
Last week in the stock market was quite choppy as the S&P futures traded lower overnight on Monday, Tuesday and Wednesday. The selling only lasted into the close on Wednesday when the S&P 500 made new lows for the month. This set the stage for Thursday’s powerful rally.
It seems as though investors and many Wall Street pros were finally convinced this fall that the economy is strong. They have been skeptical for many years and they have not been buying stocks. It is possible that the stock market is finally entering the euphoric stage.
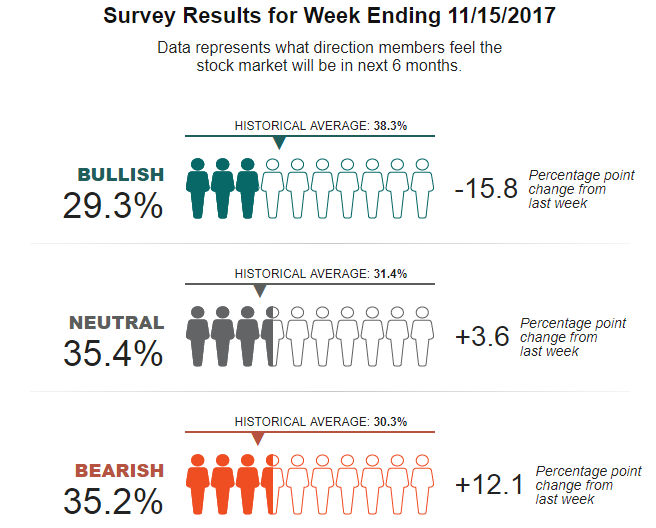
The readings from the Consumer Confidence and Consumer Sentiment do support this conclusion as they have made multi-year highs. This is in contrast to the latest AAII survey as the bullish % 15.8% last week to 29.3%. The bearish % jumped over 12% but those in the survey are looking just six months out.
Most of the economic indicators have been in positive trends since early in the bull market but there have been periods of weakness when many concluded the market must be topping. Though the short term market outlook has not yet turned back to fully positive the longer term trend is still strong.
As many of you are aware I use technical analysis to determine the trends of the economic data. This was discussed several years ago in “A Technical Look At Fundamentals”. Then I discussed how one measure of job demand peaked in the summer of 2007 well before the stock market peaked or the recession began in early 2008.


Many of the fundamental indicators resumed their uptrends in early 2016 just after the stock market had a severe decline that turned many analysts bearish. The Industrial Production had formed a short term top in late 2014 and the decline ended in early 2016 as the downtrend (line a) was broken. It has been in a clear uptrend since early 2016, line b.


The National Federation of Independent Business (NFIB) provides lots of free data on their site and they conduct a monthly survey called the NFIB Index of Small Business Optimism. The longer term chart of the index shows a pattern of higher highs and higher lows going back to the bottom in 2009. It also corrected from early 2015 to the spring of 2016 when the downtrend, line a, was broken. It dropped in September but is still in a clear uptrend.


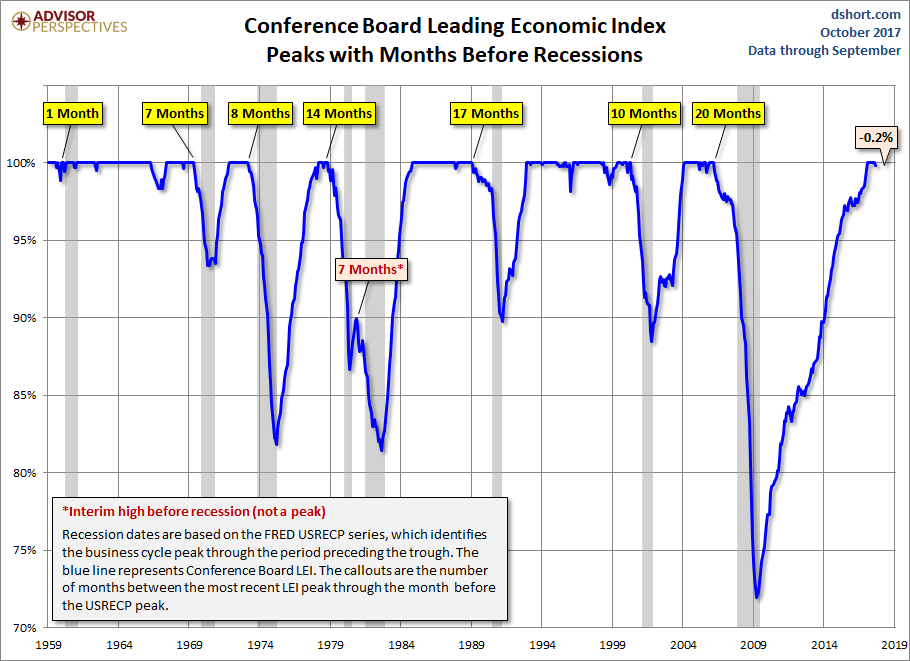
The Leading Economic Index (LEI) from the Conference Board is one of my favorite composite readings on the economy. The longer term chart from dhsort.com shows the long term history of the indicator with recessions highlighted in gray. Their research (see chart) shows that it has a good record of topping out well before the start of a recession.
The LEI declined in September for the first time in a year and we get the latest reading on Monday November 20. It would take several lower readings over a period of months before one could conclude that the LEI had topped out.


There are many ways to monitor the regional manufacturing activity and the Philadelphia Fed Business Outlook Survey is also a good predictor of Industrial Production. The steep downtrend from the November 2014 high in the Philadelphia Fed Survey, line a, was broken as it surged in February 2016. The data shows a solid pattern of higher lows though it has corrected from the February highs.
There are a number of data series that I follow on the housing market and the favorite is the Housing Market Index. As I commented previously The HMI is a monthly survey of NAHB members, which asks them to rate their prospects for single family homes at the present and for the next six months. It formed a solid bottom in early 2012. Housing Starts on Friday surged 13.2%.
In the holiday shortened week we have the Chicago National Activity Index on Tuesday along with Existing Home Sales. Then on Wednesday we have Durable Goods and Consumer Sentiment with the flash reading on the PMI Composite on Friday.


In spite of the recent new highs in most of the major stock market averages it has been an unusual few months in the markets. The iShares Dow Transportation (IYT) made a high of $181.57 on October 13th but then closed lower on the day at $178.76.
At Wednesday’s lows at $169.45 the IYT was down 6.6% from the highs. The weekly starc- band is at $167.37 with the August lows at $162.38. The relative performance (RS) has formed lower highs since late in 2016, line b. This divergence has been confirmed by the drop below the support at line c. This indicates IYT will not be a market leader for some time. The OBV also formed a divergence and has dropped below its WMA.

Crude oil completed a significant bottom in early September when the majority of analysts were bearish. After a sharp rally there was another good buying opportunity in early October where Viper Investors bought the Vanguard Energy ETF (VDE) while traders bought the SPDR S$P Oil & Gas Exploration (XOP).
The strong economic numbers are in contrast the flattening of the yield curve which by standard interpretation suggests that bond investors still do not have confidence in the economy. I am not sure this is the only explanation but it is something to watch. The chart of the 10 T-Note yield shows the break below good support in September (line a). This was followed by an equally sharp move above the resistance, line b, in late October.
A drop below 2.300%, line c, will suggests the upside breakout was indeed false. On the chart I have also added the closing yields for several maturities to highlight the small difference in yields. The two year yield is just 0.62% below the ten year yield. More surprising is the fact that the thirty yield period is only a 1% higher.


Gold futures rose $18.30 on Friday as it made a new high for the month. There is next key resistance and the daily starc+ band in the $1308 area. A close back above this level should signal a rally to the $1350 area. This is consistent with the strong action of the OBV which broke through resistance, line b, in early November. The Herrick Payoff Index (HPI) also shows a bullish formation. Viper ETF investors and traders are long gold and silver ETFs.

The PowerShares QQQ Trust (QQQ) dropped back to the 20 day EMA on Wednesday and formed a doji. This set the stage for last Thursday’s sharp push to a new high and the doji buy signal. The daily starc+ band is at $156.12 with monthly pivot resistance at $157.26. The rising 20 day EMA is at $152.17 with the daily starc- band at $151.11. There is further support at $150, line a.
The Nasdaq 100 A/D moved slightly above the October 20th high on Thursday calling the negative divergence, line b, into question. Another day or two of positive A/D numbers early this week will mean another rally for the QQQ. The daily OBV broke its uptrend, line c, on Tuesday and just reached its WMA on Thursday’s rebound.


The Spyder Trust (SPY) has closed slightly lower the past two weeks with the doji low at $256.36. The low last week was $255.63 and a daily close below this level is likely to signal heavier selling. The 20 week EMA is at $250.34 with further support, line a, at $247.60. The quarterly pivot is at $247.63. The weekly starc+ band is at $264.22.
The weekly S&P 500 A/D line has been flat for the past few weeks but the daily A/D line bounced back above its WMA on Thursday. The divergence that was formed on the November 7rh high was confirmed on Wednesday as it dropped below the October 25th low. A couple of strong days on the upside is needed to overcome this divergence.
The main hurdle for the week ahead is the fate of the tax bill in the Senate as it seems quite likely they will see more Republicans come out against the current plan. If that happens before Monday the market could get hit on the open.
There was improvement in the technical outlook last week which allows for another push to the upside. In support of this view is fact that several sectors appear to have completed their corrections which presents some new opportunities for Viper ETF traders this week.
The strong action in the iShares Russell 2000 (IWM) suggests that it may be ready to take over leadership from the SPDR Dow Industrials (DIA).
Still one needs to be selective in new purchases until a new rally is confirmed. Viper Hot Stock traders covered some short positions last week and are working some open buy orders.
In the Viper ETF Report and the Viper Hot Stocks Report, I share my A/D analysis twice each week and give specific buy and sell advice. Each service is only $34.95 per month and can be cancelled on line.
Comments
comments