Investors had a ray of hope last Thursday as stocks had the best day since early September. The calm was quickly shattered before the US open on Friday as crude oil and Chinese stocks resumed their plunge. In early trading crude was down over 5% while the S&P 500 was down over 2% again.
One interesting development that I did not get much attention early Thursday was the drop in the number of bullish individual investors according to AAII. In Thursday's pre-open Tweet I pointed out that the bullish% at 17.9% was lower than it was at the March 2009 bear market low when it stood at 18.9% (see chart)
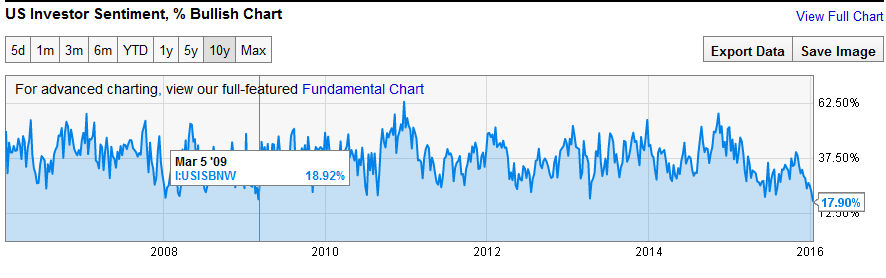
On Thursday afternoon AAII pointed out in a Seeking alpha post that the current reading was actually the lowest since April 2005. At the time the S&P 500 was undergoing a 7.5% correction which ended a week after the low in sentiment. Of course the technical picture was much more positive then than it is now.
During the bull market the drops in the bullish% to 20% or lower have preceded important market lows. Even during last summer's market decline the bullish % only dropped as low as 21.1% at the end of July. The highest reading since February 2015 was the reading of 40.4% at the end of October. Typically there is a much higher reading in bullish sentiment at major bull market highs.
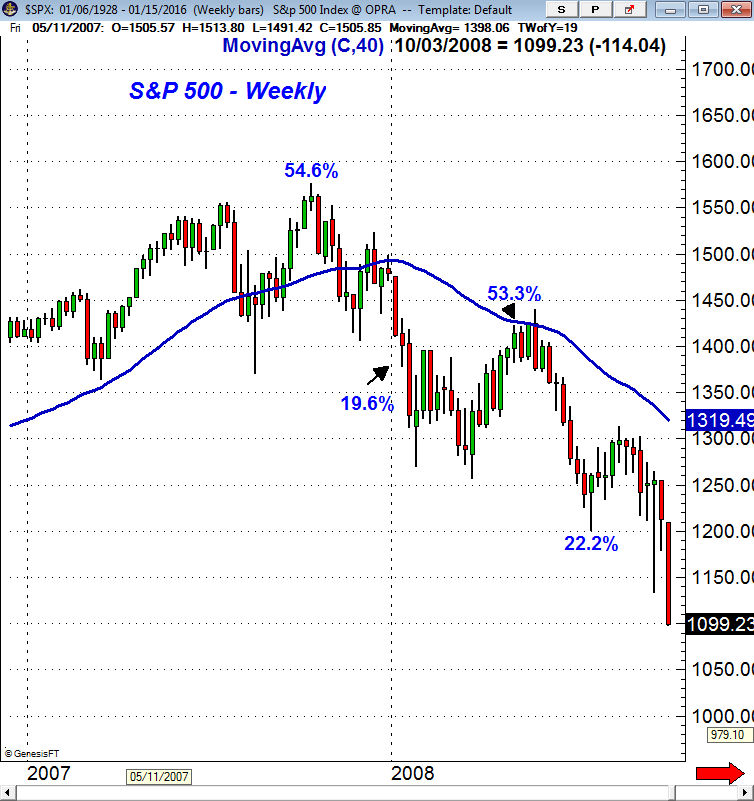
For example at the market's peak in 2007 the bullish% was over 54%. By early January it had dropped to 19.6% and the market bottomed at the end of the month. From the chart one can see that the S&P bounced for a couple of weeks before dropping to a new correction low in March as the S&P. This put the S&P 500 down over 20% from the October 2007 high.
Just seven weeks off the March low the bullish % had risen from 20.4% to a high of 53.3% in early May. On this rally the S&P 500 retraced 50% of its decline but by the end of May the rebound was clearly over. A similar rally from last week's low could take the S&P 500 back to the 2000 level.
The bear market forecasts reached a fever pitch last week as Societe Genrale's Albert Edwards is looking for a drop of 75% in the S&P which would take it to 550. It should be noted that in 2010 he was looking for a drop to 450 in the S&P 500.
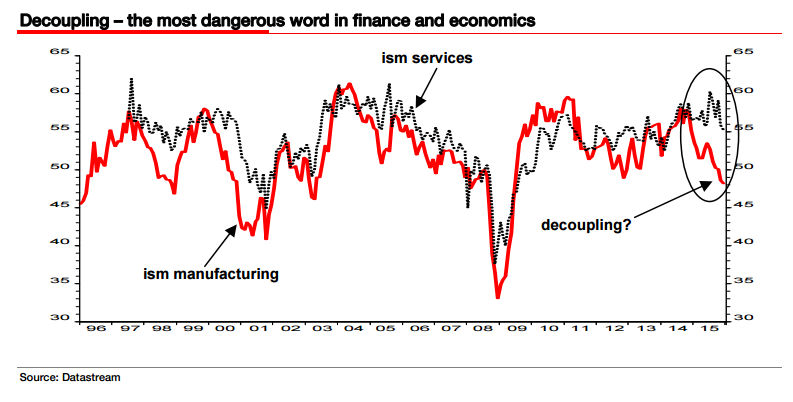
His current thesis focuses on the decoupling of the manufacturing and services sectors. On teh chart one can see that this is what happened in 2000 as the data on manufacturing dropped well ahead of the services data. This has been evident since last summer as I noted last week. In 2000 the manufacturing data peaked out in November 1999 but the S&P 500 continued higher until March 2000.
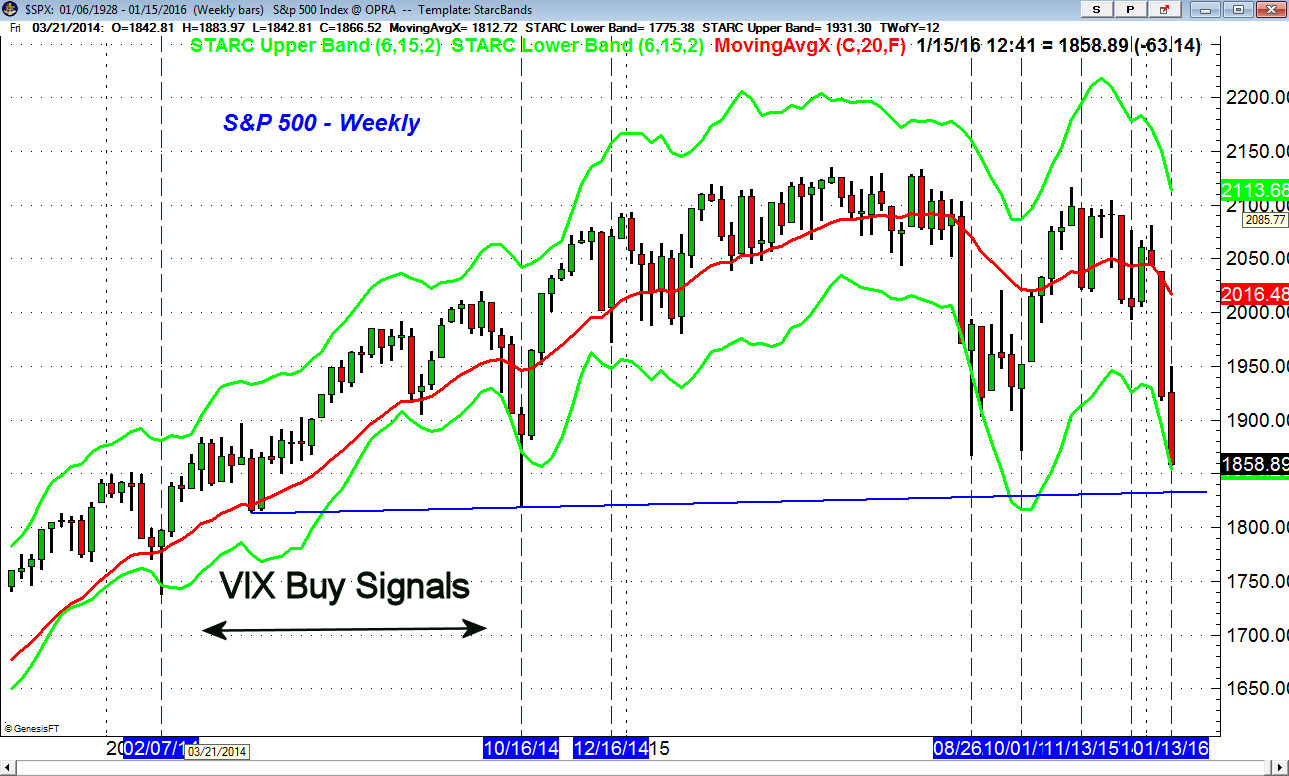
By mid-day Friday the S&P 500 was trading below the weekly starc- band at 1894. For next week the starc- band is at 1858 with next major support, line a, in the 1820-1830 area. With so many focused on the support at 1867 from last August these lows may have to be violated before the market can bottom out.
On the chart I have also identified the positive signals from my a proprietary model on the VIX index that I developed over the past two years. In many instances, like in February 2014, these signals have coincided with drops in the S&P 500 below the weekly starc- bands. Last summer the two signals came five weeks apart as the first was followed by an 8% rally from low to high.
The sharpness of the current decline has been very painful for investors but it has been more characteristic of a panic correction that the beginning of a bear market. Bear markets also do not normally start with individual investors being so negative on stocks. The big wall street firms do often not get it right either and according to Barron's annual roundtable of experts there is "little chance that the market will rally sharply in 2016".
Also according to Barron's several Wall Street strategists are lowering their forecasts as Federated Investors' Stephen Auth has slashed "his S&P 500 index target for year-end to 2150 from 2500".
Institutions and pension funds also are holding a high level of cash which is also not consistent with the start of a bear market. According to a recent Wall Street Journal article " Large public retirement systems and open-end U.S. mutual funds have yanked nearly $200 billion from the market since mid-2014".
Though it is early in the earnings season it has not started off too badly. This has not helped those that have reported as even though Intel (INTC) beat on earnings and revenues the stock was down 9% in Friday's session.
Two of the big banks that beat on earnings like JPMorgan Chase (JPM) and Wells Fargo (WFC) were also hit hard last week. This is probably another indication that the selling is starting to reach panic levels. if you are a stock trader you may find last week's article "Scanning Stocks For Winners & Losers" beneficial.
It will likely take a sustainable rally in crude oil and further better than expected earnings results to help the market start to turn around. This could start as soon as next week but the first sharp rally will just be part of the bottoming process.
The Economy
Most of last week's data came on Friday as the PPI fell 0.2% on Friday which reversed the gains from the prior month. This will not help the deflationary fears that are once again starting to grip the market as RBS told clients to "sell everything" as they warned of a "global deflationary crisis".
For several years I have been more worried about deflation than inflation as it is much more difficult to counteract. I have always argued that those who feared massive inflation after the stimulus packages would be wrong.
It is interesting that these same "experts" are still complaining and some now want to force the Fed to follow set rules to manage interest rates and the economy. I would have thought by now that they would have realized from their past errors that this is not possible.
Friday's Retail Sales were down 0.1% which was a bit weaker than expected. For the year it was just a 2.1% gain for Total Sales. The bright spots were restaurants as well as home furnishings which were up 0.8% and 0.9% on December.
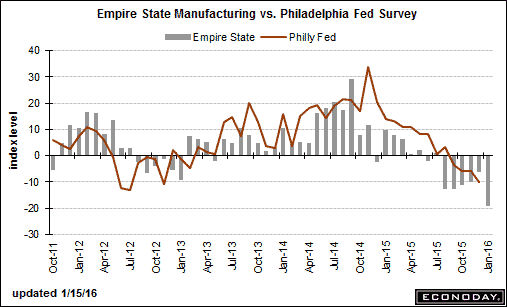
There was more weak data on manufacturing as the Empire State Manufacturing Survey came in at -19.37 much worse than the expected drop of 4. This is consistent with the current downtrend in the Philadelphia Fed Survey and we will be get new data on Thursday.
Industrial Production was also down more than expected at 0.4% and also on Friday the Business Inventories contracted a bit more at down 0.2%. There was one bright spot on Friday as the strong mid-month reading on Consumer Sentiment of 93.3. One of its components did weaken in a likely reaction over China and the markets.
Even though the markets are closed Monday there is a full slate of economic data this week starting with the Housing Market Index on Tuesday. This survey of home builders tell us how they rate the general economy and housing market conditions.
The Consumer Price Index and Housing Starts are out on Wednesday followed by the Chicago Fed National Activity Index, flash PMI Manufacturing Index, Existing Home Sales and Leading Indicators on Friday.
Interest Rates & Commodities
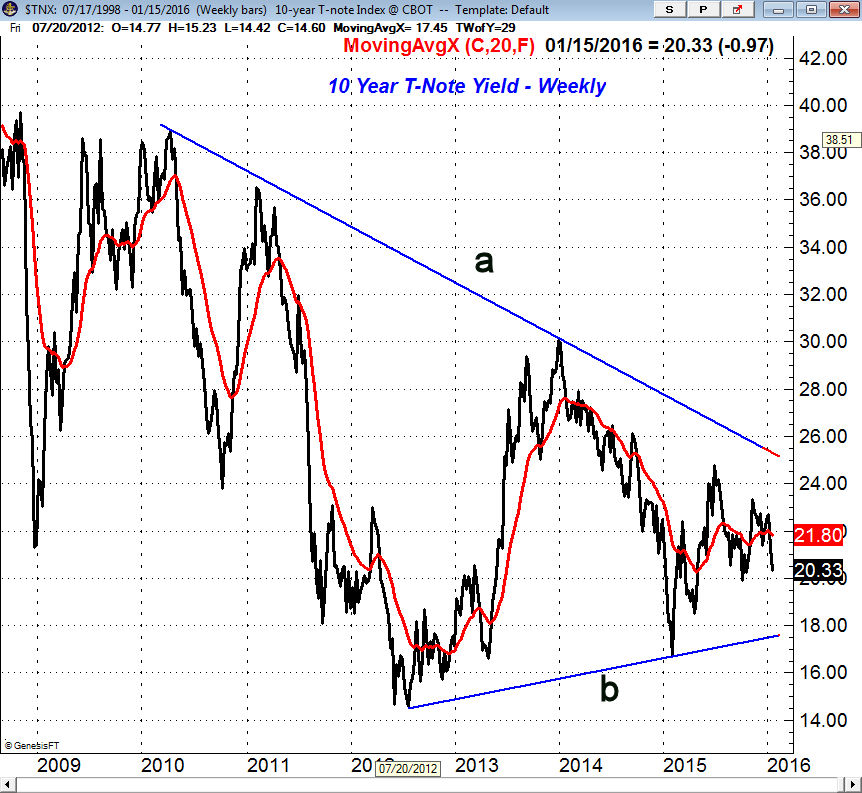
The yield on the 10 year T-Note dropped below 2.00% briefly last week and closed at 2.03% well below last week's close. The key level I have been watching is still in the 1.90% area as a weekly close under this level would signal a drop down at least to the 1.75- 1.80% area, line b. Such a decline would add to the deflationary fears.
Of course the focus has been on crude oil which had another rough week dropping below the $30 area. Downside forecasts continue to go lower as more are talking about $20 crude with some actually talking about $10 crude. Though it may get that low in a year or two on a short term basis the high degree of bearish sentiment makes a rally likely as it did in the spring of 2015 when it rallied from $44 to $60.
Market Wrap
There is not much positive that you can say about last week's action as the Dow Transports and Russell 2000 led on the downside again losing 3.7%. The Dow Industrials and S&P 500 as both were down 2.2% while the Nasdaq Composite was down 3.3%.
The market internals were very negative with 2756 stocks declining and just 461 advancing. This has pushed the weekly McClellan oscillator to its most oversold levels since June 2012. There have been several days over the past week or so where the market internals have been extremely negative. Such readings have a reliable record of signaling very powerful rebounds.
Only the utilities managed a gain for the week as they were up 0.48% while the materials were the worst losing 4.8% followed by a 3% drop in consumer services and financials. The defensive health care and consumer goods also lost 2%.
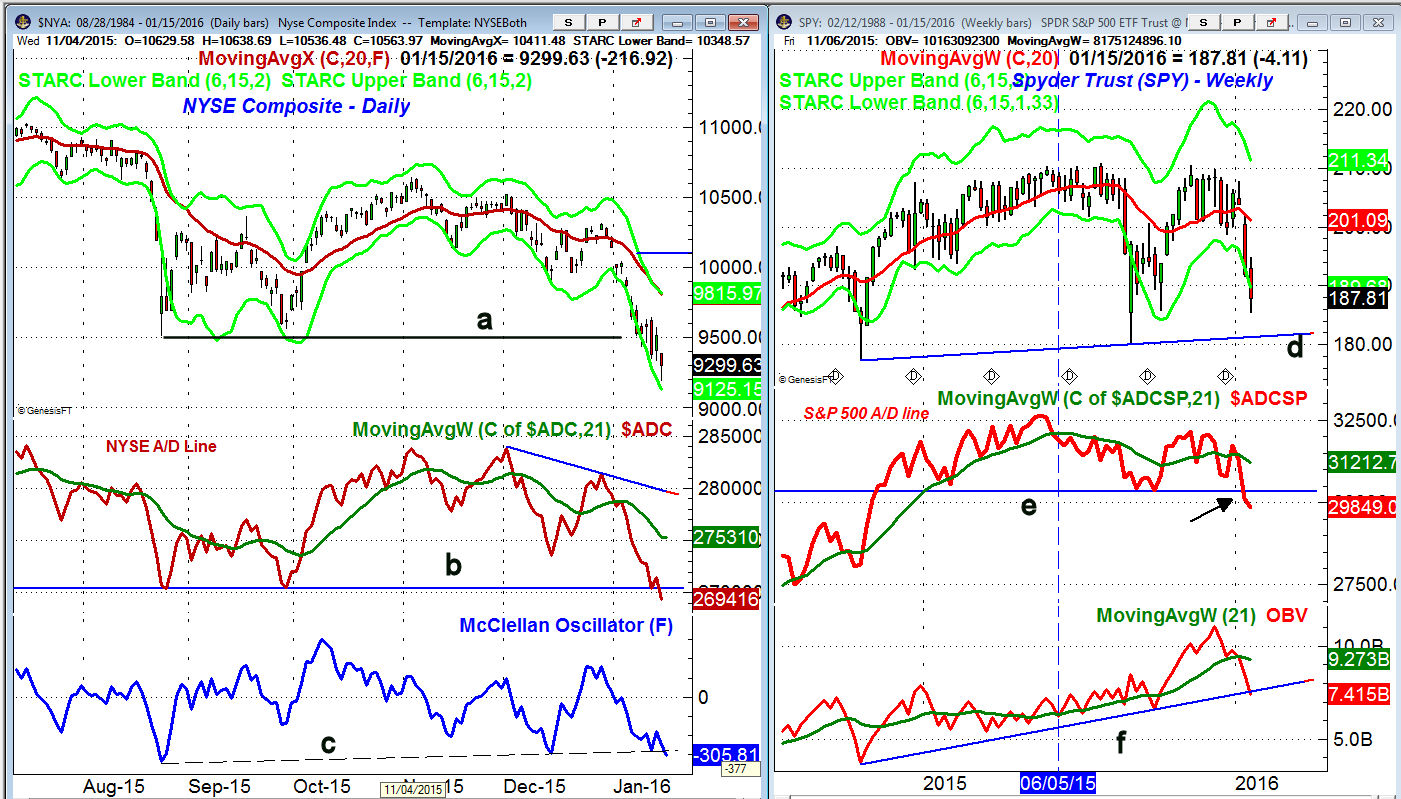
The NYSE Composite did close Friday well above the day's lows which were very close to the daily starc- band. The weekly starc- band was also tested last week and drops below this band since 2014 have marked interim lows. The sharply declining 20 day EMA and starc+ band are at 9815 which is 5.5% above Friday's close.
The NYSE A/D line dropped decisively below the summer lows on Friday, line b, which is a sign of weakness. The weekly A/D line (not shown) is at its lowest level since December 2014. The daily McClellan oscillator closed at -305 which is below trend line support (line c) but still above the August low of -335.
The Spyder Trust (SPY) closed the week below its starc- band at $192.33 and for this week it is at $189.68. The weekly chart support (line d) is at $181.50 with the August low at $180.38. The S&P 500 dropped as low as 1857 on Friday but closed the week at 1880.
The daily starc- band was tested again on Friday with resistance now at $190 to $194.86 where last Wednesday's rally failed. This is 3.7% above the declining 20 day EMA which is now at $196.43. The close was 7% below the 20 week EMA at $201.09.
The S&P 500 A/D line has dropped below its weekly support at line e which is negative. The daily A/D line is just barely below its lows while the S&P 1500 A/D line closed the week just above the August lows. The weekly OBV is just below the long term support at line f but is still above the September 2015 low.
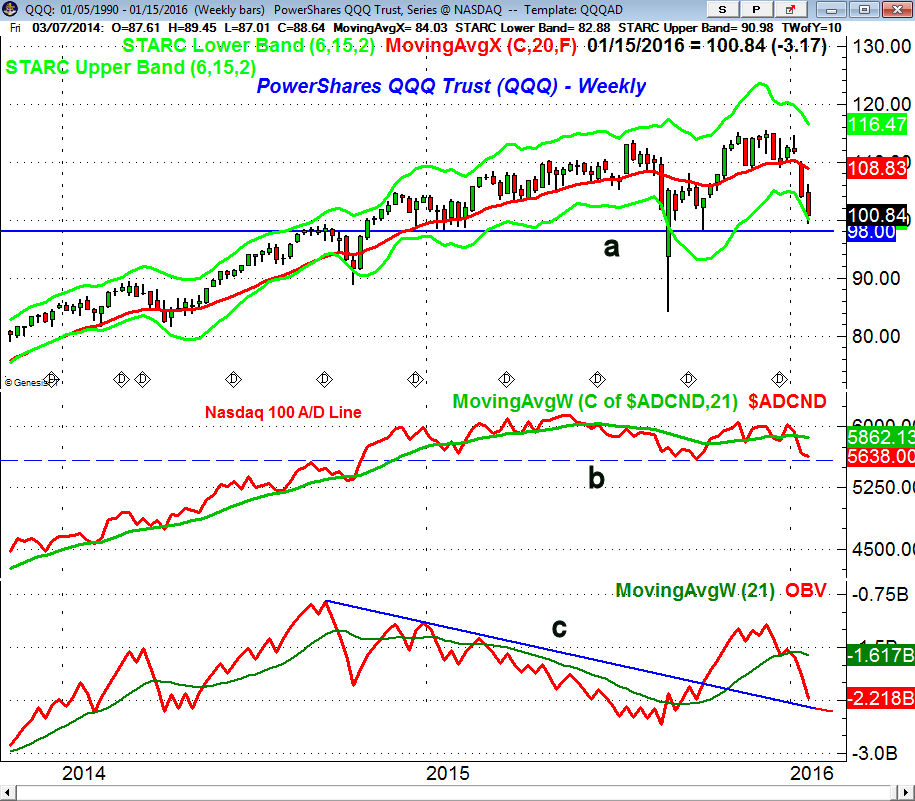
The biotech stocks were hit hard last week but the PowerShares QQQ Trust (QQQ) is still holding up better than the S&P 500. The QQQ closed at the weekly starc- band with next major support, line a, in the $98 area. There is short term resistance now at $104.50-$106 with the declining 20 day EMA at $107.50. It is 6.6% above the Friday close.
The Nasdaq 100 A/D line is well below its WMA but is still above the support from last summer's low, line b. The weekly OBV is back to the breakout levels, line c, and is now well below its declining WMA.
The iShares Russell 2000 dropped held up better than the QQQ on Friday as it was down 1.75% versus over a 3% drop in the QQQ. The IWM is now very close to the monthly uptrend from the 2009 and 2011 lows which is in the $98 area. The small caps could lead once a rebound gets underway.
What to do? For most investors the question is how much more pain are we likely to endure before a decent rally?
With everyone watching the 1857-1867 area this level may need to be broken before we get a short term bottom. The next major support for the S&P 500 is in the 1820-1830 area which is 3% below the Friday close.
Though a short term rally is likely this week unless it is very strong in terms of market internals and price action it is likely to be just the first part of the bottoming process. Given the severity of the decline even a 1-3 week rebound may be met with another wave of selling and a test of the prior lows before an intermediate term bottom could be completed.
Though the weakness in the A/D lines are now a major concern the recent decline, in my experience, does not look like the first phase of a new bear market. The price structure of a rally will tell us more as the rally in the spring of 2008 had the features of a classic bear market rally. Those who have decided that they are too heavily invested in equities will be able to adjust their portfolio on the rally.
For traders once there are clear signs of a bottom there should be a good short term trading opportunities. If you want specific entry/exit advice on ETFs you might check out my Viper ETF Report .
Comments
comments