

Editor's note: If you like Tom's analysis,check out ViperETF.com, his premium newsletter.
The stock market reversal the week of November 9th through the 13th surprised many investors as well as analysts and did some short term technical damage. As I noted last week this made the action early last week quite important.
A sharp oversold rally was likely after the selling on November 12th but last Tuesday the rally appeared to have stalled as the market gave up its early gains. The weak close set the stage for another wave of selling last Wednesday but instead the market put in a very strong performance as the FOMC minutes triggered even more buying.
As I discuss in the Market Wrap section this week's strong close maintains the positive momentum generated from the October 2nd reversal low. This further calls into question the August and September warnings of a new bear market and a recession.
For example, Citibank's chief economist Willem Buiter was quoted in September as saying "A global recession starting in 2016, led by China is now our Global Economics team's main scenario. Uncertainty remains, but the likelihood of a timely and effective policy response seems to be diminishing."
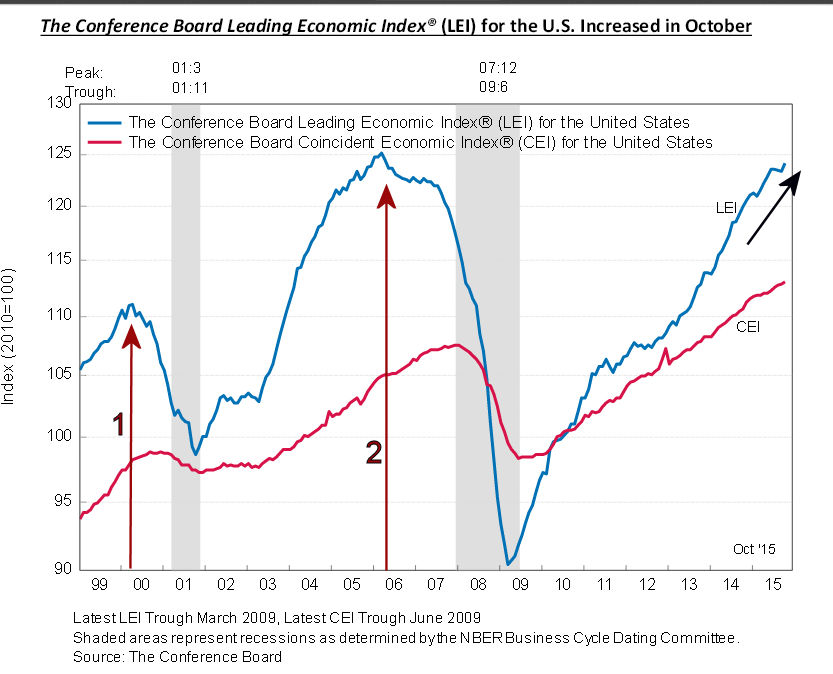
However, last Thursday's release of November's Leading Economic Indicators (LEI) indicates that stock investors should not be concerned about an imminent recession. The November reading at 0.6% according to Econoday " is a sudden indication of acceleration ahead".
The chart of the LEI now shows a clear resumption of the uptrend and from a historical perspective this is quite important. For example in early 2000 the LEI peaked (line 1) which was well ahead of the official start of the recession in March 2001. The LEI also gave an excellent warning in the spring of 2006 when the LEI also turned lower, line 2. This was twenty months ahead of the recession's official start in December 2007.
In past columns I have referred to the excellent charts from dshort.com showing how the LEI typically peaks well ahead of the start of a recession (see chart). Investors who are avoiding stocks because of recessionary fears now have strong evidence from the LEI that a new recession is not yet on the horizon.
By comparing the LEI chart with the S&P 500 investors can gain additional insight into the markets major trend. From the latter part of 2003 until 2006 the LEI was in a strong uptrend as it improved each month.
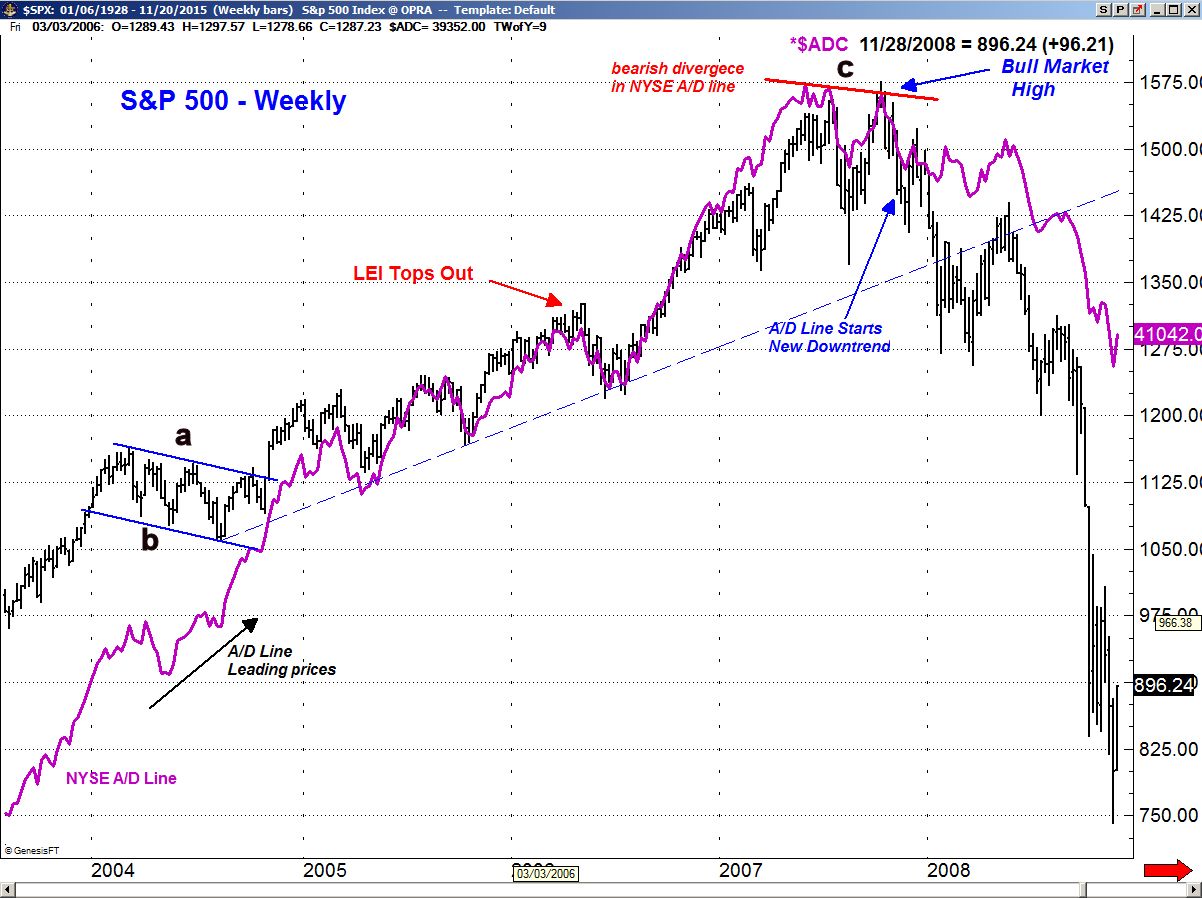
The chart of the S&P 500 reveals that it developed a flag formation , lines a and b, that was completed in November 2004. As the S&P 500 was correcting the weekly NYSE A/D line (in purple) was acting much stronger than prices as it had already moved to new highs several months earlier in July 2004.
The A/D line continued to form higher highs in 2005 and 2006 as it made further new highs in May as the LEI was topping out. The A/D started to surge again in the fall of 2006 as the S&P 500 rose from the 1260 to over 1550.
The NYSE A/D line peaked in June 2007 and then made lower highs in July. As the market was making its bull market high in October 2007, the A/D line formed even lower highs, line c. By the end of November the A/D line had dropped below the August low thereby forming a new downtrend which confirmed that the bull market had topped out.
The weekly NYSE A/D line formed a short term divergence in May but since neither the S&P 500 or the NYSE Composite has yet surpassed the spring highs no longer term divergences have yet been formed. The potential for more serious divergences to be formed was discussed "Why New Highs Could Send A Warning".
If the S&P 500 or Spyder Trust (SPY) were to make a new all time in the next few months it will be important that the new highs be accompanied by new highs in the A/D lines. To confirm new weekly uptrend in the A/D lines the October highs need to be overcome.
On Friday the ECB's Mario Draghi expressed his concerns that the inflation rate could fall well short of its 2% target and he said " we will do what we must to raise inflation as quickly as possible". This makes further easing likely at the December 3rd meeting which should give the Euro zone as well as the global markets a boost.
Even though many of the US indices and the Stoxx Europe 600 posted better than 3% gains for the week it is important that the global markets become even stronger. The German Dax still needs to overcome the key 61.8% Fibonacci resistance at 11,220. It would also be helpful if the Shanghai Composite was able to now move back above the 3750 level.
In a recent special report for Viper ETF subscribers I pointed out how the regional and country specific ETFs can often be quite effective in giving your portfolio a boost. They trade quite well technically and therefore even a small commitment to these ETFs can have a big impact.

Since the early October lows the Materials Sector Select (XLB) has led the market higher up 16.4% as of Friday afternoon trading well ahead of the 11.27% gain in the Spyder Trust (SPY). As I noted in last week's "Can Strong Sectors Weather The Storm?" the weekly technical outlook, including the relative performance analysis had identified XLB as a market leader.
The Industrials Sector Select (XLI) and the Consumer Discretionary (XLY) are both leading the SPY higher. The Health Care Sector Select (XLV) has continued to lag though there were signs last week that it may be ready to catch up with the other market leading sectors.
The Economy
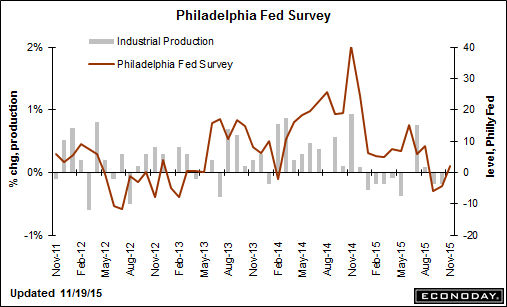
It was a another mixed week for manufacturing data as the Empire State Manufacturing Index was weaker than estimated at -10.74. Later in the week the Philadelphia Fed Business Outlook Survey came in better than expected at 1.9. This followed two negative months as it has moved slightly back into positive territory. The Industrial Production also was weak for the second month in a row. On Friday the Kansas City Fed Manufacturing Index rose for the first time since last February.
There was not much good news for the housing market as the Housing Market Index dropped two points while Housing Starts were down 11% in October. Permits were up which was a slight positive.
On Monday we will get the Chicago Fed National Activity Index, PMI Flash Manufacturing Index and Existing Home Sales. Then on Tuesday we get the preliminary reading on 3rd quarter GDP, as well as the S&P Case-Shiller Housing Price Index and Consumer Confidence.
This is followed on Wednesday by Durable Goods, New Home Sales and Consumer Sentiment from the University of Michigan. Of course the markets are closed on Thursday with a shortened session on Friday.
Interest Rates & Commodities
There was little change in interest rates last week as the yield on the 10 Year T-Note dropped slightly to 2.262%. The high yield market was a bit lower as the SPDR Barclays High Yield ETF (JNK) dropped slightly and is now not far below the early October lows.
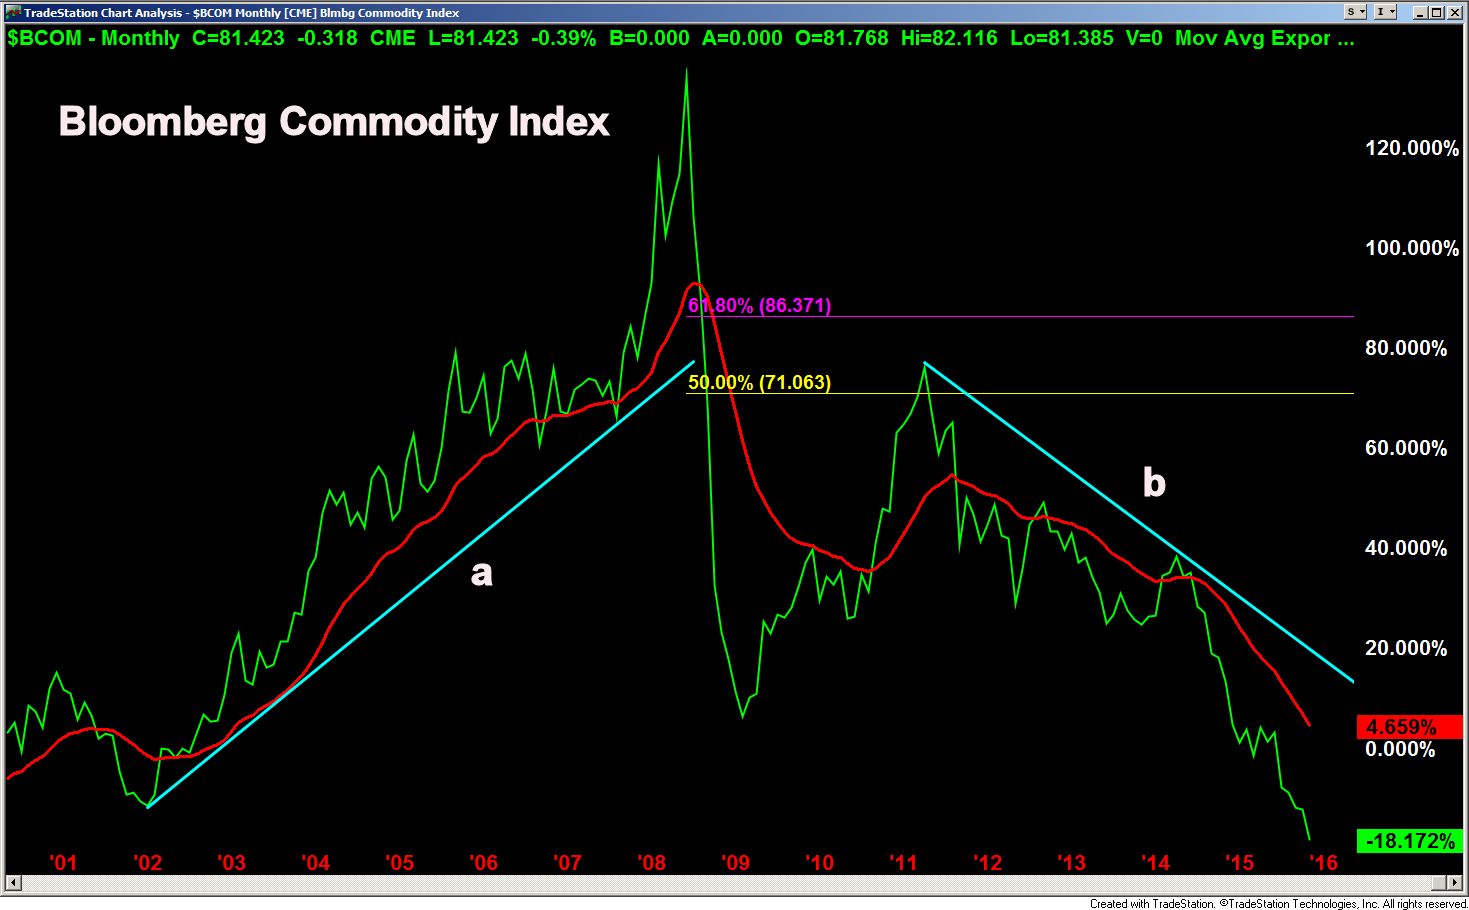
Both gold and silver continued lower last week but the losses were not as bad as the prior week. They are looking a bit sold out and the sentiment analysis indicates that both are getting quite oversold. The Bloomberg Commodity Index peaked in June 2008 but has fallen from up 136% to down just over 18%. On a short term basis good the gap between prices and the 20 month EMA indicates the index is oversold which increases the odds of rebound. However there are no signs yet of a sustainable bottom .
Market Watch
The US averages posted solid gains last week as the S&P 500 gain of 3.3% was the best weekly performance of 2015. The Dow Transports and Nasdaq Composite did even better as they were up 3.6%. small caps are still lagging as the Russell 200 was up just 2.49%.
Advancing stocks led the decliners by a 2-1 margin with technology leading the parade as it was up 4.35 followed by a 3.6% rise in industrial stocks. Consumer goods and services were both up well over 3% with just a 3.1% gain in the financials.
The sharp decline two weeks ago dampened the bullish sentiment as AAII reported the bullish % dropped 3.5 points to 30.8% which is very close to the bearish % at 30.5%. The fear index or VIX also reversed sharply last week which is a positive sign. The CNN fear & Greed Index is still neutral at 54.
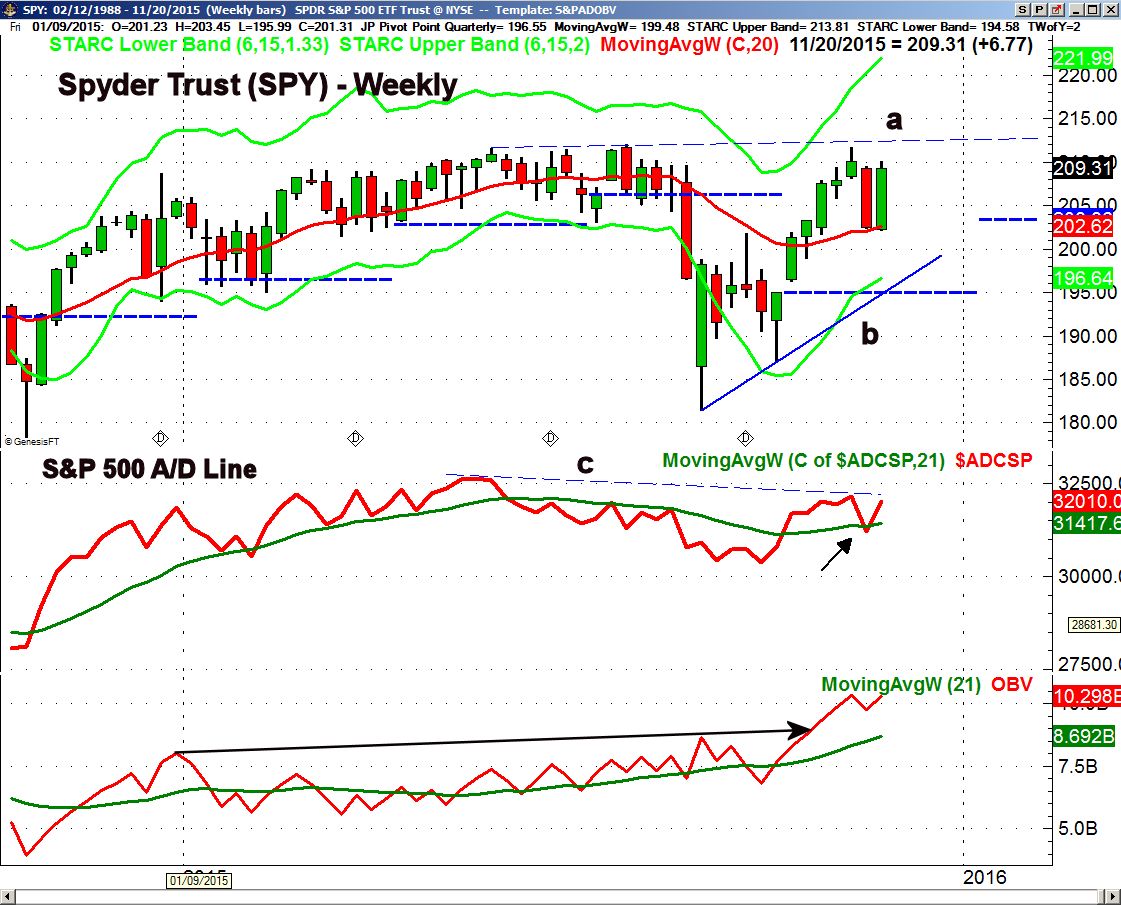
The weekly chart of the Spyder Trust (SPY) shows that the SPY held the 20 week EMA, now at $202.62, before closing strong. There is next resistance in the $213 area which if overcome could signal a move towards the weekly starc+ band at $221.99.
There is short term support now at $207.72 and the 20 day EMA with the daily starc- band at $203.80. As I noted last week the SPY had dropped below the daily starc- band on the recent correction. The weekly S&P 500 A/D line reversed back above its WMA last week which is normally a very bullish sign. A move in the A/D line above the resistance at line b, would further support the bullish case.
The weekly OBV continues to act very strong as it has already broken out to new highs. This continues to be in contrast to the daily OBV (not shown) which is below its WMA.
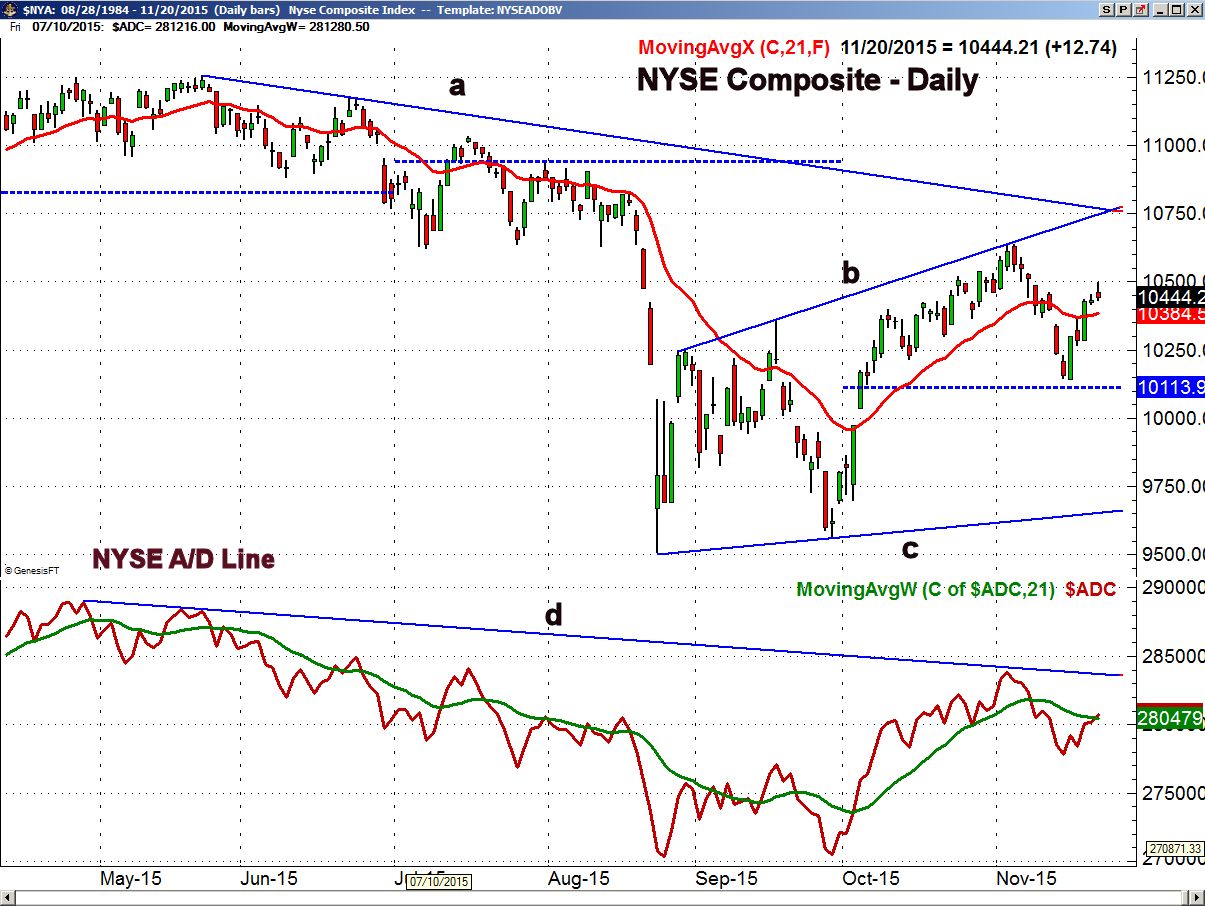
Though the weekly analysis of the SPY as well as the NYSE Composite looks strong the daily charts introduce a bit more caution into the short term outlook. In analyzing the daily chart of the NYSE Composite one cannot rule out the possibility that the rally from the October lows could be just part of a broad continuation pattern, lines b and c.
The downtrend from the May-June highs, line a, and the resistance at line b, are now converging in the 10,750 area. The 61.8% Fibonacci retracement resistance now stands at 10,587. The 20 day EMA and initial support is now at 10,384 while the quarterly pivot is at 10,113.
The NYSE A/D line is back above its WMA but does not look as strong as the weekly A/D line which turned higher after dropping back to its WMA a week ago. The daily A/D line needs to move above the early November high to reassert the market's uptrend.
The SPDR Dow Industrials (DIA) and PowerShares QQQ Trust (QQQ) both are acting well basis the weekly and daily charts. The iShares Russell 2000 (IWM) rebounded nicely last week but needs to add further gains to suggest it is ready to accelerate to the upside consistent with the January effect. I will Tweet some charts of these over the weekend.
What to do?
Though I was a bit more cautious heading into last week the strong market performance suggests that many were buying the dip. Those that sold near the lows the prior week's lows were punished by mid-week. This further validates the high risk of selling when the averages are below the daily starc- bands. Now we are entering a very strong seasonal period that generally last until the end of the year.
On a very short term basis the market could consolidate before a few days before it continues higher. New long positions as always need to be established with the focus on risk as stops for now need to be at least under the November 13th lows. I am looking in particular at health care and the emerging markets in the week ahead.
Editor's note: If you like Tom's analysis and want specific entry/exit advice on ETFs check out ViperETF.com, his premium newsletter.
Comments
comments