
It was another crazy week in Wall Street and in Washington DC but the markets again survived. In a heavy week for earnings the focus was on three of the FANG stocks, Facebook (FB), Amazon (AMZN) and Alphabet (GOOGL).
Netflix (NFLX) had reported on July 17th as it beat on earnings and revenues, opening almost 9% higher. It made a new high at $191.50 last Friday. This was 18.4% above the pre-earnings close. Was this all new buying or was there something else going on?
Some of you may not be familiar with the short interest data which reveals the number of shares of a stock or ETF that have been sold short. Though I do not base any buy or sell decision in the Viper Hot Stocks Report on the short interest I do look at it and Nasdaq.com has some of the best data. In fact a stock that looks strong technically can really be powered higher if there is a high short interest.
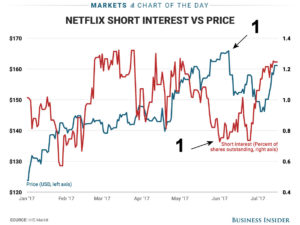

The short interest may have been responsible for the meteoric rise in Netflix (NFLX) as the short interest (in red) had risen dramatically ahead of the earning’s report. It is therefore likely fueled that the rally in part was fueled in by those on the short side who were forced to cover their positions. We may get verification with the next short interest report. It is also interesting to note that the short interest was low (point 1) as NFLX topped in June.
A few weeks ago Follow The Charts Not The Earnings I suggested that investors and traders base their buy or sell decisions on the stock charts as they head into earnings rather than try to guess at whether they were going to beat or miss on earnings. Just because a stock has better than expected earnings it does not mean the stock will always go up.

So how did Amazon (AMZN) and Facebook (FB) look last week before their earnings? AMZN had rallied for three weeks and the weekly starc+ band was at $1069.38 and there was quarterly pivot resistance at $1089. The high on Thursday was 1083.31 and it opened Friday at $1012.14.
For those not familiar with starc bands when a stock or ETF is above its starc+ band it is in a high risk buy area or a low risk sell area. Conversely when it is below its starc- band it is in a high risk sell or a low risk buy area.
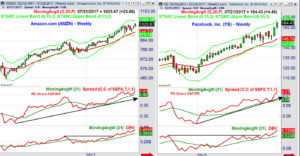
The weekly indicators for AMZN looked strong heading into this week. The relative performance moved back above its WMA early in the year indicating that it was a market leader. It was still rising sharply a week ago and showed no signs of a top. The OBV broke through resistance, line a, in April which was a sign of strength.
Facebook (FB) looked even stronger before its earnings as it has already close to the weekly starc+ band at $167.26 and had exceeded its quarterly pivot resistance. It made a high of $175.49 after its earnings and closed well above the daily starc+ band.
The RS and OBV analysis look even stronger on FB as both turned up sharply a week ago and they are acting stronger than prices. They show no signs of a top. The daily studies did make new highs before earnings which indicates any pullback should be well supported.
The high short interest in NFLX is not surprising as there have been a number of stories about traders establishing large bearish option strategies. Just last week one trader apparently established a complex $60 million position in VIX options that bet on a spike in volatility by October. The trade could result in a gain of up to $265 million if the VIX reaches 25 or of course they could lose $60 million.
In contrast there has been a noticeable increase in the bullishness of the investment professionals. Another strategist raised their upside targets which to me is not a positive. Even more concerning was a comment in Barron’s from an equities strategist that “The Market Appears Bulletproof”.
Since August is historically not a good month for stocks this type of sentiment makes me nervous. Since 1950 the S&P 500 has been up 37 years and down 30 with an average return of -0.27%. August has been an especially bad month during most of this bull market.
It has been up three years, 2009 (+3.1%), 2012 (+2.0%) and 2014 (+3.8%) but down five years 2016 (-.10%), 2015 (-6.3%), 2013 (-3.35), 2011 (-5.5%) and 2010 (-5.3%).
So can we learn anything from past August declines to prepare for the month ahead?
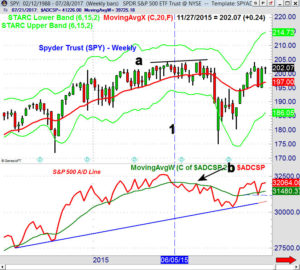

The Spyder Trust (SPY) grinded higher into May 2015 where it had a high of $204.08 and was up just over 3% for the year. On the decline from this high the weekly S&P 500 A/D line dropped below its WMA on June 5th (line 1).
The week of July 24th the SPY made a new high at $204.50 (line a) but the A/D line just rallied back to its declining WMA (see arrow). This was a sign of weakness as the SPY plunged below its starc- bands in August with the Dow down 1100 points early on August 24th.
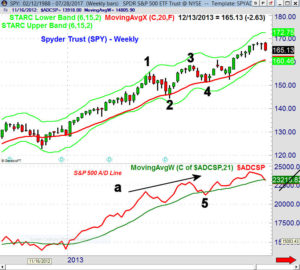
By the end of July 2013 the Spyder Trust (SPY) was already up 21% for the year as it had gained 4.7% for the month. The weekly chart shows that the SPY peaked in late May, point 1, and then declined 7.4% in just six weeks (point 2) as it dropped back to support at the 20 week EMA.
The weekly S&P 500 A/D line made a significant new high with prices in May and then held well above its rising WMA on the pullback. Just six weeks later the SPY had made a convincing new high at 158.51, point 3, in early August that was confirmed by a new high in the A/D line.
The 4.6% correction from the high in the Spyder Trust (SPY) lasted just four weeks (point 4). The A/D line dropped slightly below its WMA for one week (point 5) before the A/D line again turned higher. Three weeks after the low, SPY was making a new high.
The S&P 500 had August declines of over 5% in both 2010 and 2011. In my A/D line analysis it is important to look at the monthly, weekly and daily time frames. Since December 2009 the monthly NYSE A/D line has made a new high each year which is consistent with the positive major trend. During the bull market the weekly A/D lines have moved into the corrective mode several times and stayed corrective for the last half of 2015.
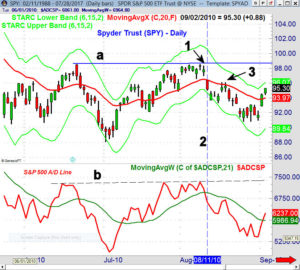
The daily A/D lines can help traders find opportunities but also can be useful for investors as they often identify correction lows. The daily chart shows that the Spyder Trust (SPY) made a high on June 21st 2010 before dropping 10.6% in eight days to bottom on July 1st.
By August 9th the SPY had made it back to $98.03, line a, and formed a doji. The daily S&P 500 A/D line made a marginal new high, line b, and the next day the SPY triggered a daily doji sell signal. The SPY then gapped lower and closed weak as the A/D line dropped below its WMA (line 2) and violated its previous lows.
After SPY tested its daily starc- band for a few days it bounced back to the declining 20 day EMA. This was a selling opportunity for short term traders. The SPY dropped below the $91 level five days later and formed a short term bottom. From the August 9th high the SPY had dropped 7.6%.
The current bullish readings of the weekly A/D lines do not suggest a prolonged correction like what occurred in 2015 but a short term correction cannot be ruled out. Therefore it is not a time for investors or traders to be complacent. The daily monitoring of all the A/D lines ( “Wait For Signs of A Correction” ) can give you the insight to spot a correction as it is occurring.
The Economy
In a rocky week for the stock market the economic news was generally better than expected. On Monday the flash reading on the PMI Composite beat expectations and Existing Home Sales missed.
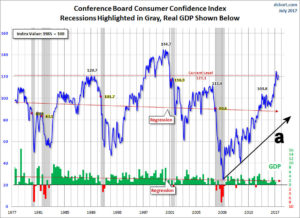

The Consumer Confidence hit a 16 year high on Tuesday. The long term chart from dshort looks very strong and clearly there are no signs that it has topped out as it has before past recessions.
The New Home Sales Wednesday met expectations while Thursday’s Durable Goods at 6.5% were well above the consensus estimate of 3.5%. The Chicago Fed National Activity Index at 0.13 was also better than expected.
Friday’s advance reading on 2nd quarter GDP came in at 2.6% as expected while the Consumer Sentiment at 93.4 was a bit better than the consensus of 93.1.
This week the economic calendar is again full with the Chicago PMI and Pending Home Sales Index on Monday. This is followed Tuesday by the ISM Manufacturing Index and the PMI Manufacturing Index.
Thursday we get the ISM Non-Manufacturing Index, the PMI Services Index and Factory Orders followed by the monthly jobs report on Friday.
Interest Rates & Commodities
The yield on the 10 Year T-Note rose to 2.289% last week up from 2.232%. Still the rise in yields was not enough to turn either the weekly or daily MACD analysis positive. The key resistance is still in the 2.40% area and a weekly close above this level will favor higher yields.
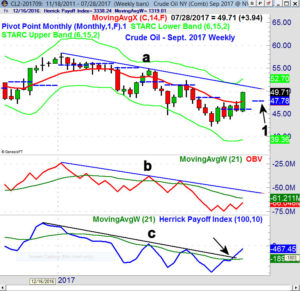

The September Crude oil contract rose 8.6% last week after a sluggish rally over the previous five weeks. As I noted two weeks ago the daily indicators had turned bullish. The weekly downtrend, line a, is now at $51.20 with the weekly starc+ band at $52.70.
It is a positive sign that the monthly pivot is higher in August, point 1, as it is consistent with a change in the trend. The monthly pivot been declined for the previous five months.
The daily OBV looks strong but the weekly is still well below its WMA and the downtrend, line b. The Herrick Payoff Index (HPI) has moved strongly through its downtrend, line c, and is well above its WMA. Viper ETF investors and traders went long energy ETFs two weeks ago even though a weekly bottom had not been confirmed.
Market Wrap
The Dow Industrials managed over a 1% gain last week but all of the other major averages were lower with the Dow Transports losing 2.6%. The S&P 500 was down a fraction while the tech heavy Nasdaq 100 lost 0.18% which was better than the 0.46% drop in the small cap Russell 2000. The NYSE A/D numbers were just barely positive last week.
For the week telecommunication stocks rose 6.5% and which was much better than the 1.9% gain in the oil and gas stocks. Health care was the big loser down 1.34% followed by a 0.90% drop in the technology shares.
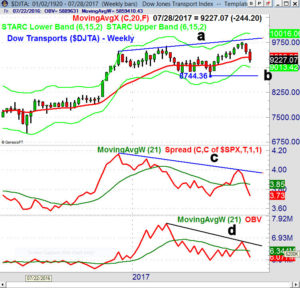

The biggest negative last week was the sharp decline in the Dow Transports as several components reported good earnings but still dropped. It did close below the quarterly pivot at 9304.80 and the 20 week EMA at 9302.92. The weekly starc- band is at 9013 with major support, line b, at 8744 which is 5% below Friday’s close.
The relative performance has dropped sharply over the past two weeks and is well below its WMA. The RS did form a negative divergence at the recent highs, line c, as it failed to make a new high with prices (line a). The weekly OBV shows a similar bearish divergence, line d, and volume has been heavy over the past two weeks pushing the OBV below its WMA.
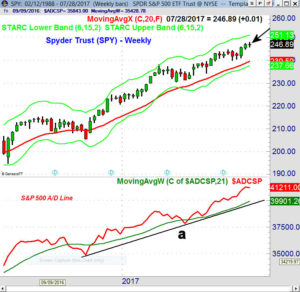

The weekly chart of the Spyder Trust (SPY) shows that it formed a doji last week so a Friday close below $245.68 will trigger a doji sell signal. There is weekly support at $244.60 with the rising 20 week EMA at $239.50. The quarterly pivot is at $239.77 with the weekly starc- band at $239.50.
The weekly S&P 500 A/D line turned down slightly last week but is well above the rising WMA and support at line a. The daily A/D line made a new high on Tuesday. It is above its rising WMA and the early July highs.
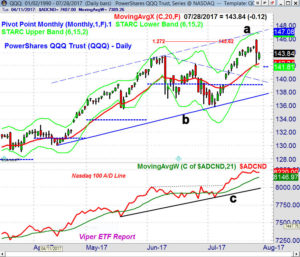

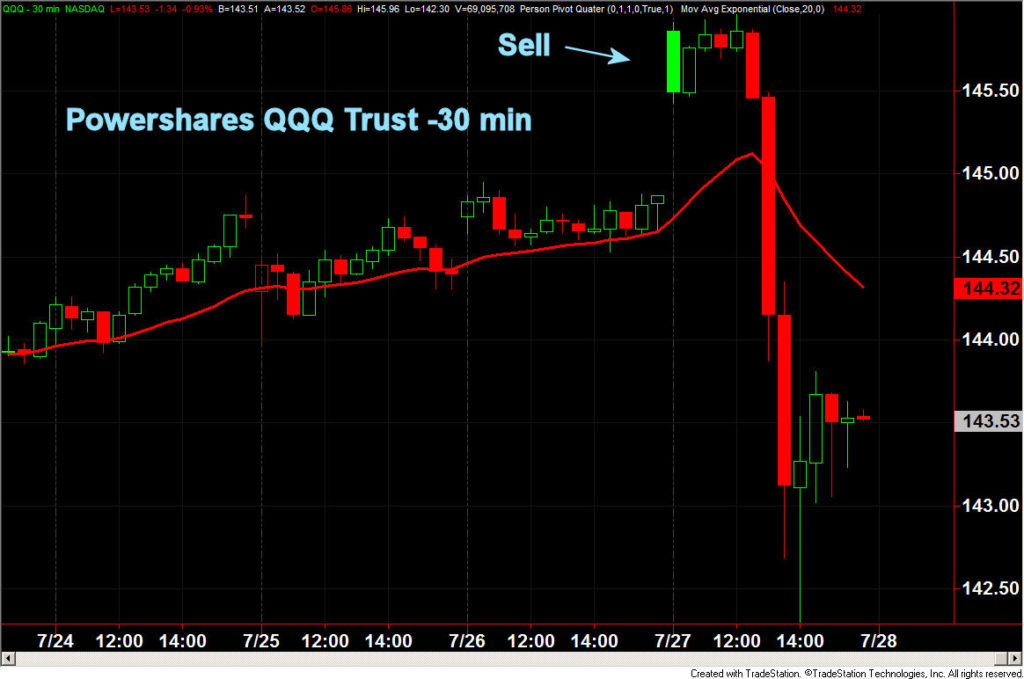
The Powershares QQQ Trust (QQQ) opened Thursday at $145.86 where Viper ETF traders sold longs. The 127.2% Fibonacci target was exceeded on the open. There is now short term resistance at $144.50-$145 with stronger in the $147 area, line a. The 20 day EMA was tested on Thursday and the August monthly pivot is at $141.87.
The Nasdaq 100 A/D line made a new high on Wednesday and is still above its clearly rising WMA. The weekly A/D line made a marginal new high last week and is 4% above the rising WMA. The QQQ did form a doji last week so a weekly close below $142.30 will trigger a weekly doji sell signal.
What to do? It is likely to be another volatile week as Thursday‘s wide range may set the tone for the next few weeks. With Apple (AAPL) reporting after the close on Tuesday and the monthly jobs report on Friday it could be an interesting week.
The very weak action of the Dow Transports last week and the failure of several sector to make convincing new highs warrants a more cautious approach. It would take several consecutive days of strong selling to drop the A/D lines below their WMAs and put them into the corrective mode.
If there is a correction it is not likely to change the major trend as a 3-4 week decline, similar to 2013, is more likely. During such a correction more sector rotation is likely as new market leaders are likely to emerge. One new country ETF was added to the Viper ETF portfolio and it closed on the week’s high.
Viper Hot Stock traders have been working around the earning’s report as I generally look to take at least partial profits before a report. As we get further into earnings there will be even better opportunities in those stocks which have already reported.
In both the Viper ETF Report and the Viper Hot Stock Reports the two 4-5 page weekly updates include my the A/D line analysis as well as specific recommendation.
Each service is only $34.95 per month and can be cancelled on line at any time.
For more about my trading strategies you can download a copy of my eBook. This will also add you to the email list for the free Viper Reports. I send out market commentary and technical tips several time a week. Additional market comments are often posted on the Viper Report Facebook page.
Comments
comments