

Editor's note: If you like Tom's analysis,check out ViperETF.com, his premium newsletter.
It was a good week for the stock market heading into the monthly jobs report though comments mid-week from Fed Chair Yellen again raised the possibility of a December rate hike. The other economic data for the week was mixed as while the manufacturing sector is still struggling the services sector looks strong.
The surprisingly strong gain of 271,000 jobs blew away expectations as the consensus view was for a gain of around 180,000. Stocks declined initially in reaction to the data but closed mixed.
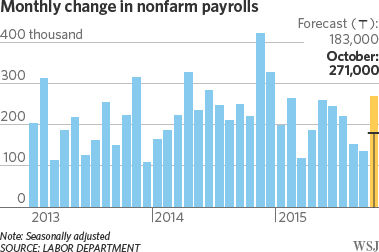
The GDP chart shows that this was this was the best job gain since December 2014 and October's data is a clear positive for the economy as construction along with professional and business services showed the most gains. The average hourly wages are up 2.5% from a year ago and this could help stem the Fed's fears over deflation.

The yield on the 10 Year T-Note had been edging higher all last week but surged to the upside in reaction to the jobs report. The daily chart shows that the downtrend, line a, is now at 2.47% and a close above the June high at 2.53% will signal even higher yields.
The MACD- His (a popular momentum indicator) formed a bullish divergence at the recent lows, line b, and turned positive on October 27th. The weekly MACD ( not shown) just turned positive on Friday. As I have been saying for most of the year I do not think that higher rates will be negative for stocks as a stronger economy will be much more important for stock prices.
So why would I be concerned if the S&P 500 made a new all time high in the next several weeks?
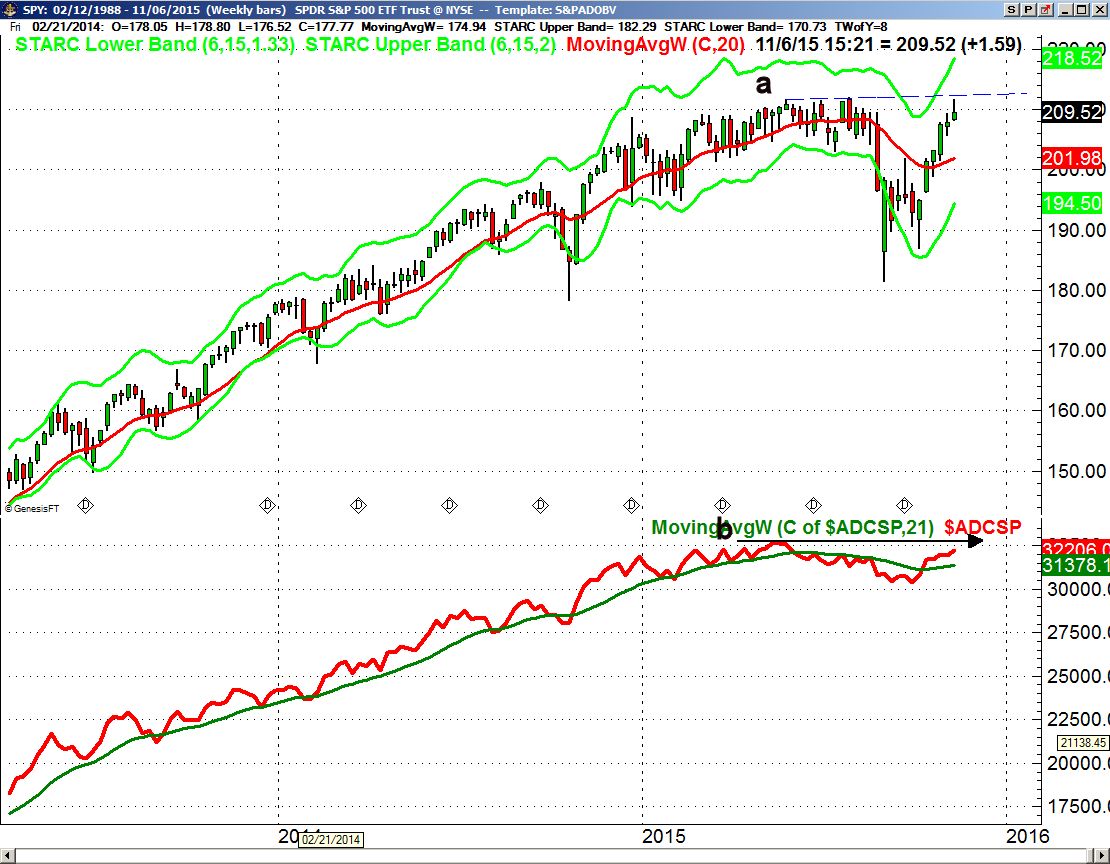
The weekly chart of the Spyder Trust (SPY), which tracks the S&P 500, shows that it hit a high of $211.66 this week but appears ready to close well below the week's high. A strong move above the May high at $213.78 is not out of the question as it is just over 2% above Friday's close.
If the SPY and S&P 500 do make a new high it will be important that both the weekly and daily S&P 500 A/D lines also make a new high. This would mean a move above the resistance at line b. The failure of the A/D lines to confirm the new highs could send a warning to stock investors. The NYSE Composite and its A/D line, which I cover in the market warp section, are both still well below their 2015 high.

Of course the higher yields pushed the dollar sharply higher as the weekly chart shows that it has completed its flag formation, lines a and b. There are initial upside targets in the 103 area while the upside projections from the flag formation are in the 105 area (see arrow). The Herrick Payoff Index signaled positive money flow three weeks ago on October 23rd as it moved above the zero line and its WMA.
A stronger dollar will continue to impact the earnings of some of the multi-national companies while the corresponding weaker Euro will help the earnings in those exporting Euro zone companies. Several of the country specific ETFs for the Euro zone are looking more positive technically. I will be looking for new buy candidates in these ETFs next week for subscribers of my Viper ETF Report.
The Economy
The week started off with more data on the manufacturing sector. It was surprising that the manufacturing PMI according to Markit " Manufacturing production increased at a robust and accelerated pace in October, with the rate of expansion the fastest for seven months."

The regional Fed data has been much weaker and the ISM Manufacturing Index came in at 50.1 just barely above the key 50 level that divides expansion and contraction. This data series is still in a solid downtrend so the November numbers now have more importance. Factory orders were down in October for the 11th time in the past 14 months.
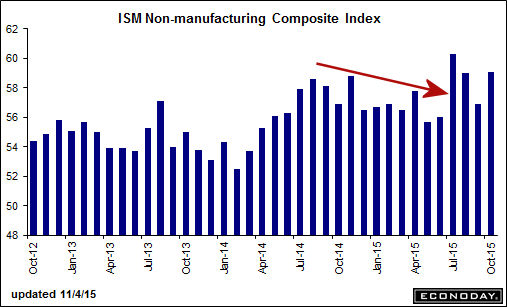
On Wednesday the ISM Non-Manufacturing Index came in strong at 59.1. Four months ago I pointed out the break of the downtrend and the continued strength suggests an expanding economy which is in contrast to the other data that suggests a sluggish economy.
There is a light calendar this week as on Wednesday, banks are closed but the stock market is open for Veterans day. On Friday we get the PPI, Retails Sales, Business Inventories and Consumer Sentiment.
Commodities
As I noted in my October 17th column "With Weak Data Are Stocks Still The Best Bet?" the technical studies on gold "suggests the current rally will likely ultimately fail." I was looking for one more rally to get short but we did not get it as the SPDR Gold Trust (GLD) lost 4.75% last week.
Crude oil remains under pressure as the January contract dropped $1.77 per barrel. The strength of the oil stocks still suggests that crude is close to a bottom . As long as the January contract can hold the $43.50 level I am not expecting another sharp push to the downside.
Market Wrap
Even though most of the major averages closed the week below their best levels the overall tone was bullish with the market internals positive again last week. The small caps led the market higher with the Russell 2000 gaining 3.26% while the S&P 500 was up just 0.95% and the Dow Industrials gained 1.40%. The Dow's closed higher for the sixth week in a row.
The utilities bore the brunt of the selling as the Dow Utilities dropped 4.14%. The financials jumped on the jobs report as they were up 2.38% followed by a 2.34% gain in the oil & gas stocks. Technology stocks also did well as they were up close to 2% while consumer goods were down 1%.
Though the earnings have been better than expected this season there were several companies that disappointed the market last week. QUALCOOM (QCOM) was down 10% while Groupon (GRPN) dropped over 28%.
There were also some big winners but as I discussed last week those who held a very large position in Valeant Pharmaceuticals (VRX) were hurt further last week as the stock lost another 18%. All investors should take the time to be sure all of their funds are really diversified.
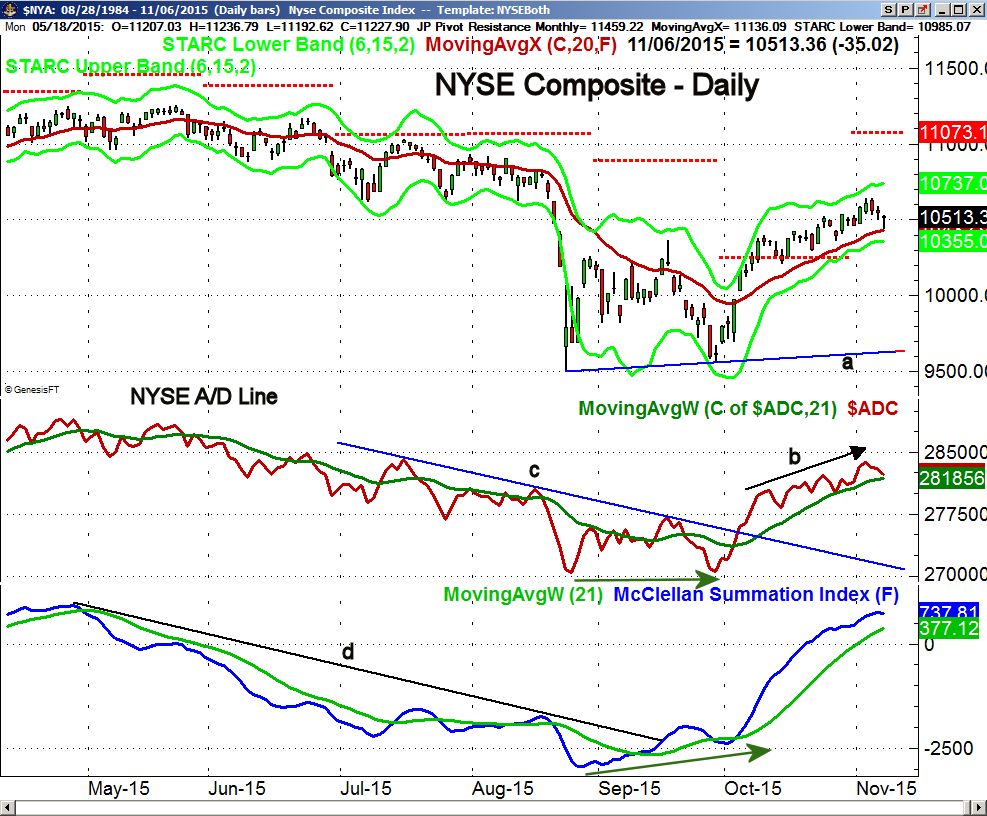
The NYSE Composite dropped down to test its WMA on Friday then closed well off the day's lows. The daily starc+ bands stands at 10,737 with the monthly projected pivot resistance at 11,073. There is minor support now at 10,400 with further in the 10,200-300 area.
Both the NYSE A/D line as well as the McClellan Summation Index formed positive divergences (green arrows) at the September 29th lows. This divergences were confirmed when the NYSE reversed to the upside on October 2nd (The Week Ahead: Why Friday's Reversal Was Important).
The A/D line has continued to make higher highs which is a positive sign. A drop below the late October lows would be the first sign of a deeper pullback. The Summation Index has risen sharply from its lows and is well above its rising WMA. The negative action of the Index along with its WMA in May and June supported my view at the time that a correction was likely.
Over the past few weeks I have been looking for the small cap stocks to gain strength as they had been lagging the market. If the economy gains strength these stocks should benefit more than their large cap brethren.
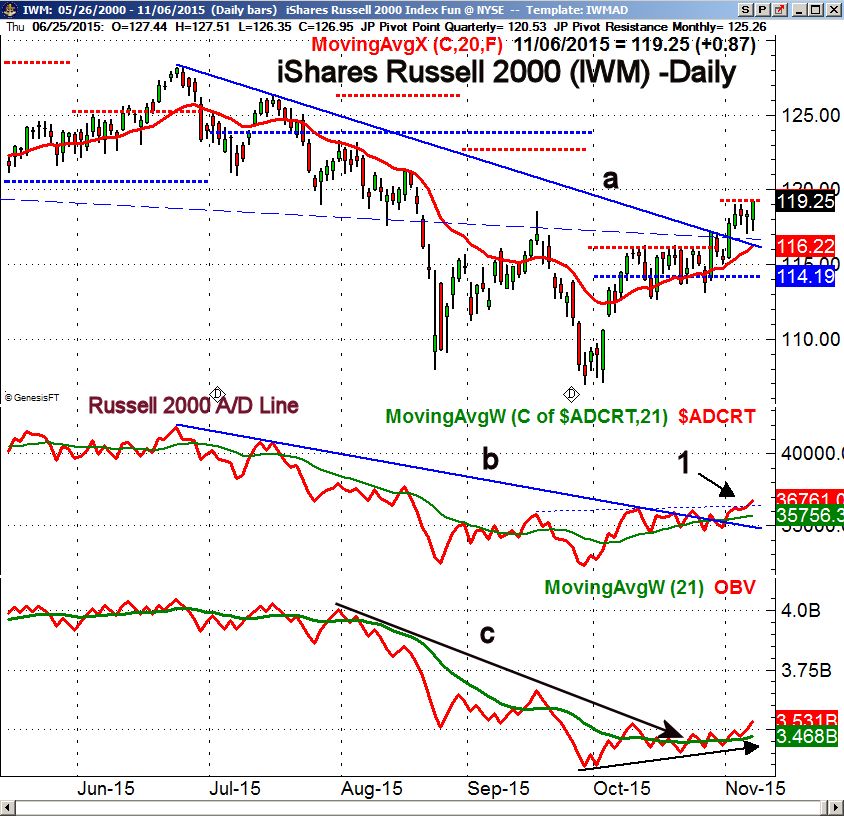
The iShares Russell 2000 (IWM) broke its downtrend, line a, on Monday confirming the strong rally the previous week. The pullback at the end of October created a low risk entry point for new long positions (see arrow) which are so far doing well. The monthly pivot resistance is now being tested with further upside targets in the $121-123 area.
The Russell 2000 A/D line moved above resistance on Friday (point 1) which confirms the break through the downtrend, line b. The OBV had also broken its downtrend and is also trying to complete its bottom formation. The daily relative performance (not shown) does suggest that IWM is now becoming a market leader.
What to do?
The sharp market gains to start off the month finally convinced more of those market bears that they were really on the wrong side of the market. Many of the top hedge funds have recorded sharp losses in the past month as they bet the already weak commodity stocks would drop even more.
This further confirms my view from July 2014 that the hedge fund bubble was bursting. Most investors who are willing to do the work I think can do considerably better than most of the hedge funds. It does require that you develop a plan and stick with it even when the markets get a bit scary.
(Hint: My Viper ETF service can help.)
While the market shows no signs yet of a significant top, sharper correction is likely in the next couple of weeks. Therefore if you have some nice open profits don't be greedy, take some profits. Any correction is likely to create some new buying opportunities.
Also as I have been stressing since before the rally began now is a good time to take a critical look at what is in your portfolio as I feel confident that you will find some positions that should be sold. If you would like some assistance with this process our staff can help you, just email me at wentworthresearch@gmail.com.
Comments
comments