

Editor's note: If you like Tom's analysis,check out ViperETF.com, his premium newsletter.
Investors were clearly not impressed last week by the much better than expected jobs report as the major averages dropped below the prior week's low on Monday increasing the focus on the downside. The selling increased on Thursday as many of the major averages dropped down to their daily starc- bands. As I warned last week a " sharper correction is likely in the next couple of weeks".
The market tone has not been helped by the comments from many Fed officials that point to a rate hike in December which the majority of economists are now expecting. The lack of consumer buying despite the much lower energy prices has been a surprise to many analysts.
In Augusts " A Replay of 2011 or 2012?" I wondered whether the ongoing correction would look more like 2011 or 2012. As the decline became more serious it was clear that the market decline would be worse than what occurred in 2012. The market reversal on October 2nd was very similar to what happened in 2011.
Looking at the historical data after the market bottom was confirmed I pointed out that " Since 1990 the S&P 500 has closed lower in September twelve times and it was down 2.46% last month. Of these twelve instances the S&P 500 only closed lower twice in October" .
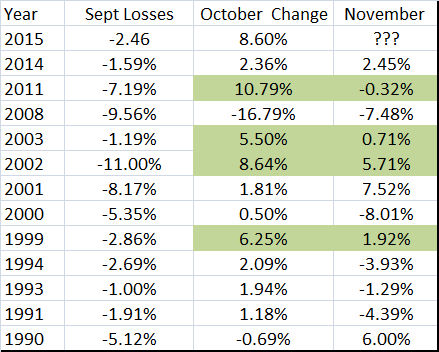
The updated table shows the 8.60% gain in October 2015 but what does that mean for November? Since 1990 there have been four times when the S&P 500 was up more than 5% after declining in September. In 2011, the 10.79% gain was followed by a loss of 0.32% in November.
In 2003 the 5.50% gain In October was followed by a 0.71% gain in November. The market was quite volatile in 2002 as after dropping 11% in 2002, the S&P gained 5.64% in October which was followed by a 5.71% gain in November.
The only other occurrence of a weak September and a higher close in October was in 1999 when the S&P 500 gained 6.25% after the weakness in September. The October gain was followed by a rise of 1.92% in November 1999.
Since 1950 November has been a good month as it has averaged a gain of 1.37% as the S&P 500 was up 43 years and down 22 years. So for November 2015 I think it is reasonable to look for the S&P to record something between a 1.5% loss and a 1.5% gain.

A closer look at the NYSE Composite performance in the fall of 2011 reveals that after a rally of 22% from the October 4th low to the October 27th high there was a sizable correction. The SPY retraced 66% of the previous rally as it made its low on Black Friday November 25th.
The rally from this low was quite sharp peaked on December 6th as the SPY corrected once more. On December 22nd (line 1) the NYSE A/D line broke its downtrend, line a. This signaled that the correction was over and the NYSE gained over 8% in the next six weeks.
As of Thursday's close the NYSE is down 38% from the high on November 3rd. If the NYSE were to undergo a similar correction as what occurred in 2011 the NYSE could drop down to the 9930 area, line c. This would mean a drop of another 2.8% from Thursday's close which could take the SPY down to the $199 area.

Many of the other major global stock markets also hit resistance and turned lower last week. The German DAX Index reached a high of 11,055 on November 6th but closed Friday at 10,708. The rebound slightly exceeded the 50% retracement resistance at 10,860 but has failed so far to overcome the key 61.8% Fibonacci resistance at 11,220.
There is next support at 10,500 with the quarterly pivot at 10,262. The daily RSI formed a strong bullish divergence at the September lows, line b. The RSI has now dropped below its WMA and a drop below the bullish divergence support (line b) would be more negative.
Data last week on the Euro zone growth came in at 0.3% as Germany and France were hit by a decline in foreign trade. This makes it more likely the European Central bank will further ease their monetary policy at the December 3rd meeting.
The Economy
The week's key economic data came on Friday as Retail Sales came in at 0.1% which was weaker than the 0.3% that most expected. Though this reflects a slowdown from the prior month the sales data does show a year over year gain of 1.7%.

The Producer Price Index fell an unexpected 0.4% while most were looking for a 0.2% gain. Though energy prices were unchanged for the month they are down 21.5% for the year while food prices are down 4.2%.
The long term chart shows that the uptrend connecting the 2002 and 2009 lows, line a, was broken earlier in the year. The chart shows a clear downtrend now as it has made lower lows and lower highs. The long term support going back to the late 1990's is still intact but from this chart deflation is still clearly a concern. It is the one factor that could keep the Fed from raising rate in December.
On the plus side Business Inventories on Friday were up 0.3% while many thought they would be flat. Also the mid-month reading on Consumer Sentiment from the University of Michigan was better than expected at 93.1.
This could be a plus for retail sales in November as the department stores like Macys (M) and Nordstrom's (JWN) were hit hard last week, losing 20% and 17.9% respectively. My weekly relative performance has indicated that they have been weaker that the S&P 500 for the past month. This made them stocks to sell.
There is a full slate of economic data this week but the focus is likely again to be on Wednesday's release of the FOMC minutes. Monday's Empire State Manufacturing Survey is expected to be weak again this month as is Tuesday's Industrial Production report. After last week's PPI the expectations are low for the CPI but the Housing Market Index has remained strong all year and we get the latest data on Tuesday.
Housing starts are out on Wednesday followed by the Philadelphia Fed Business Outlook Survey and Leading Economic Indicators on Thursday. Further data on manufacturing Friday with the Kansas City Fed Manufacturing Index.
Interest Rates & Commodities
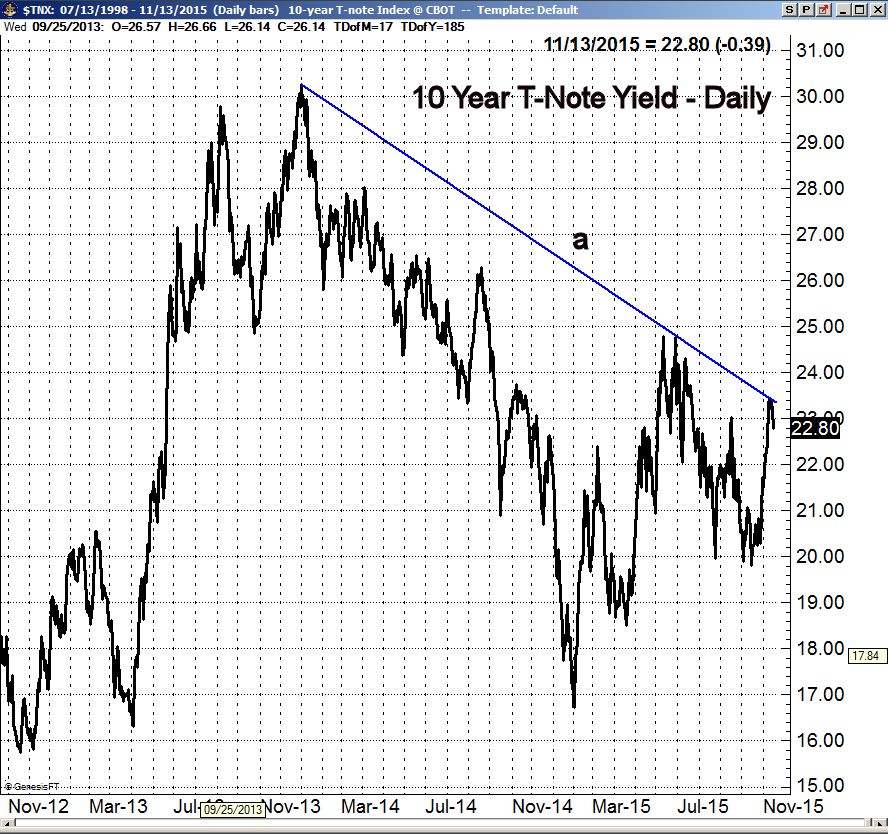
Despite the prevailing opinion that the Fed will raise rates in December the yield on the 10 Year - T-Note declined last week after testing the downtrend, line a. As discussed last week the daily/weekly momentum still favors a move higher in rates. Utilities were the only sector that closed higher even though the gains were small.
Crude oil and gold both dropped below the October lows with the January crude oil contract losing $3.50 per barrel or 7.6%. It now looks ready to test the August lows in the $40 area. The demand outlook for crude oil is still negative though bearish sentiment is also quite high so there may be some short covering if the summer lows are tested.
The SPDR Gold Trust (GLD) has already violated the July lows which is consistent with the negative technical signals that were generated several weeks ago. The weekly chart formation has downside targets now in the $100-$101 area.
Market Wrap
The small caps gave up the most last week as the Russell 2000 dropped 4.43% which was considerably worse that the 3.6% drop in the S&P 500 or the 3.7% loss in the Dow Industrials. Of course the decline in some of the individual market sectors was even worse as the oil & gas stocks were down almost 6% for the week followed by a 5% decline in the technology stocks and a 4.4% decline in the consumer services sector.
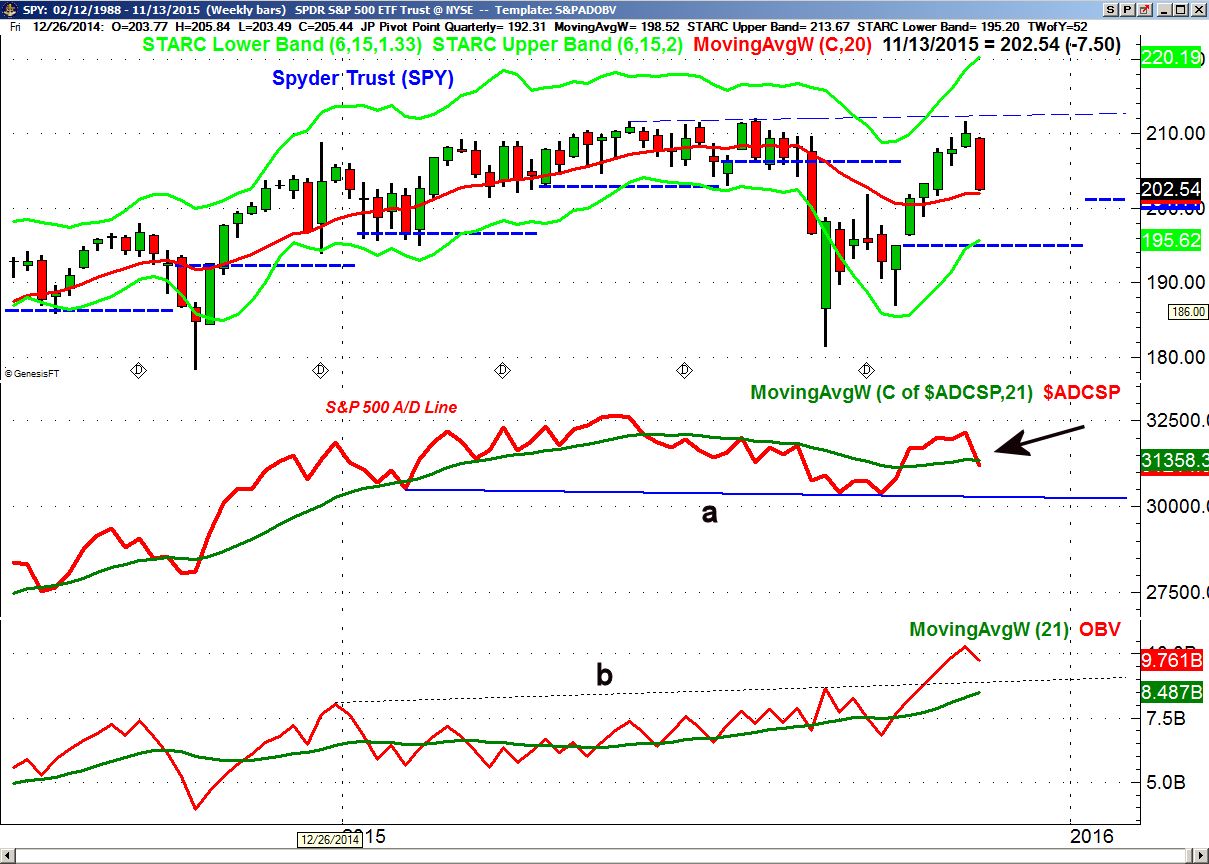
The weekly chart of the Spyder Trust (SPY) shows a weekly reversal as the close was below the lows of the past two weeks. The 20 week EMA is a bit lower at $201.99 with the four week lows at $198.94. The quarterly pivot stands at $195.06.
The weekly S&P 500 A/D line has dropped back below its WMA which is a reason for concern. There is key support for the A/D line now at the September lows, line a. The NYSE A/D line has turned lower but is still slightly above its WMA but that could change this week. The weekly OBV on the SPY has turned down but is still well above the breakout level at line b.
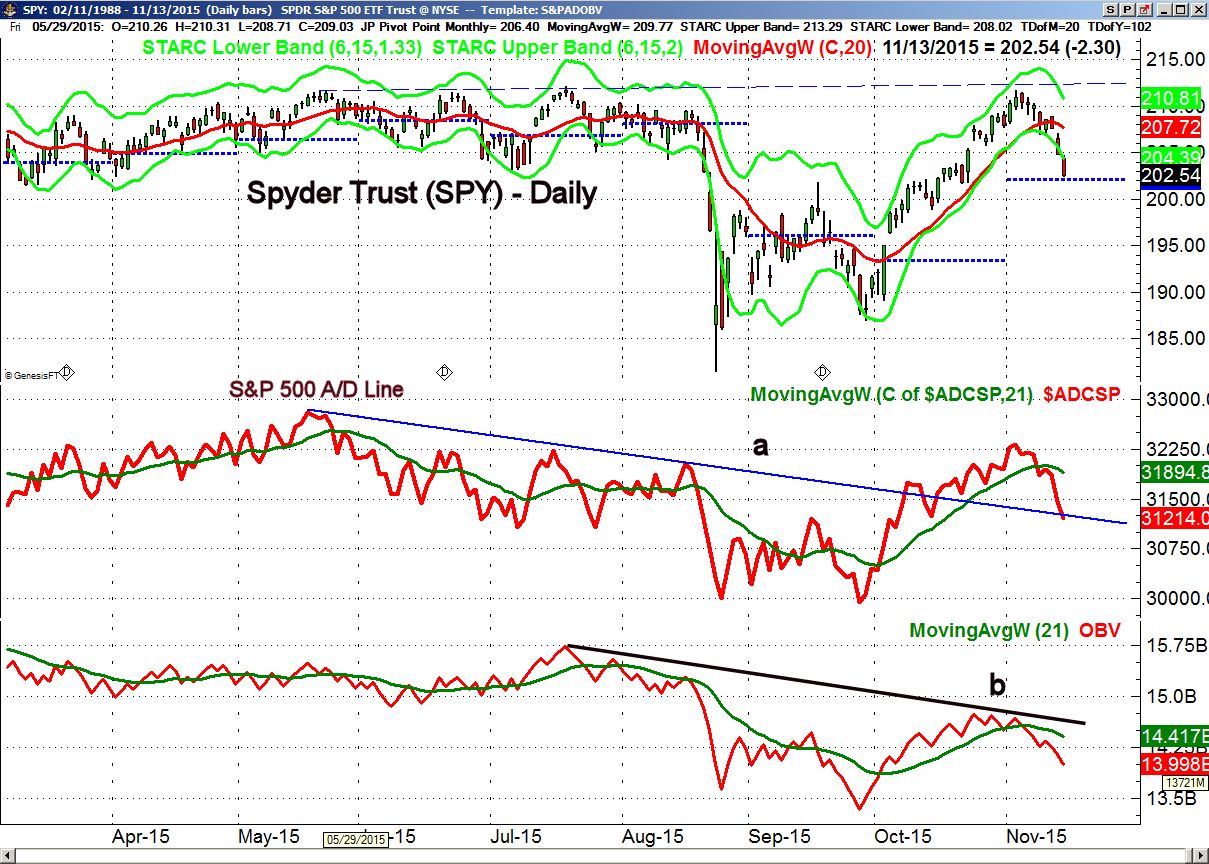
The daily chart of the SPY shows that it closed below the daily starc- bands on both Thursday and Friday. The monthly pivot is at $202.16 which is just below Friday's low. The daily S&P 500 A/D line dropped below its WMA last Monday and has since plunged sharply. The breakout level, line a, is now being tested.
The lower highs in the OBV, line b, have been followed by a sharp decline over the past week. The OBV is now well below its WMA so any bounce is likely to fail below its WMA.
[Page break]
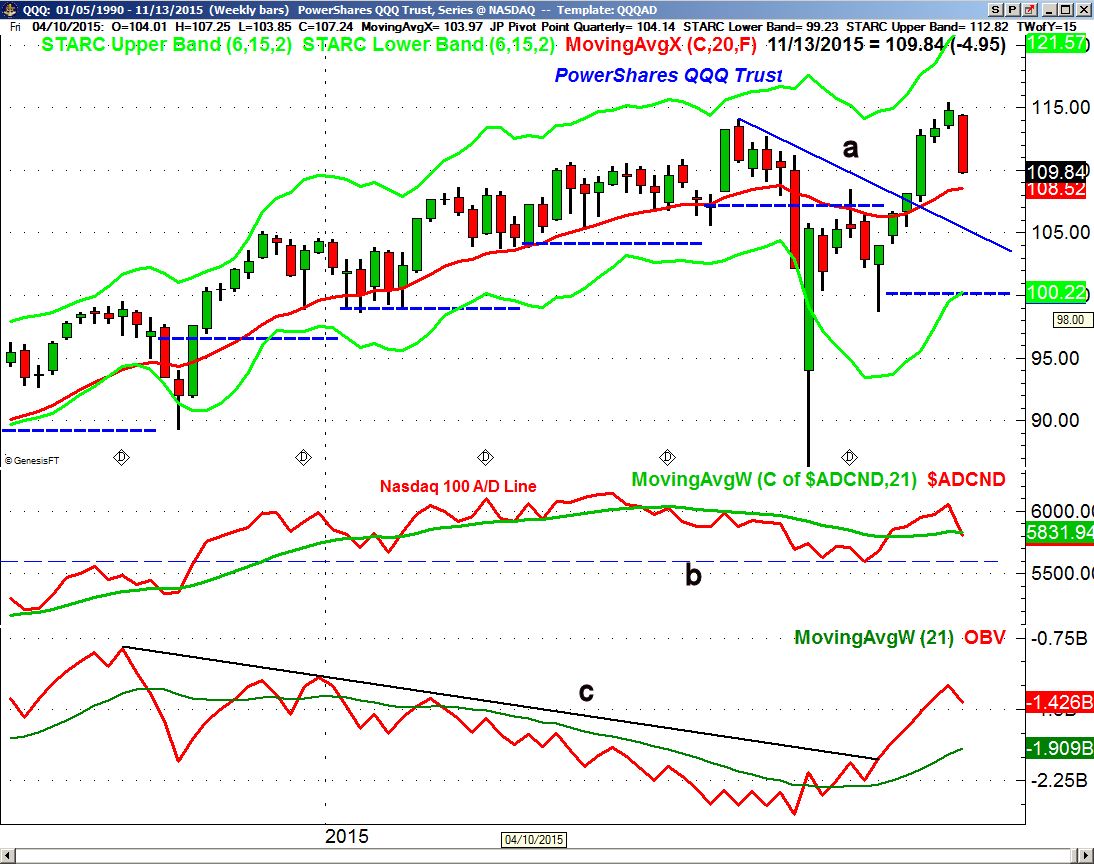
The PowerShares QQQ Trust (QQQ) also formed a weekly reversal with next support at $108.54 and the 20 week EMA. The breakout level (line a) and further support are in the $105-$106 area. The close on Friday was below the daily starc- band.
The Nasdaq 100 A/D line failed to make a new high two weeks ago and has now dropped slightly below its rising WMA. To confirm this bearish divergence the A/D line would need to drop below the recent lows at line b.
The weekly OBV looks much better as while it turned lower last week it is well above its rising WMA. The weekly OBV broke its major downtrend, line c, in early October.
The iShares Russell 2000 (IWM) closed the week below the prior week's lows which has called the recent bottoming action into question. The daily chart shows that a doji formed at quarterly pivot support which does favor at least a bounce over the near term. The 20 day EMA is at $116.21 with further resistance at $117-$118.
The weekly and daily charts of the SPDR Dow Jones Industrials (DIA) does look very similar to the other major averages. There is next good support in the $168.50-$170 area.
What to do?
The daily technical studies identified a good risk buying opportunity after the October 2nd reversal but the daily sell signals last week emerged very quickly. In last week's column I commented that a " sharper correction is likely in the next couple of weeks. Therefore if you have some nice open profits don't be greedy, take some profits. Any correction is likely to create some new buying opportunities."
The weekly reversals now warrant a more cautious approach over the next two weeks. The very negative A/D numbers last Thursday do favor a sharp rebound this week that could take the major averages and ETFs back to their 20 day EMAs.
This rally should provide an opportunity to get out of trading long positions and should give investors a chance to raise some cash. I hope you took the opportunity on Monday to sell some of your positions in those stocks or ETFs that have been lagging the S&P 500.
From an intermediate term standpoint the current correction needs to be over by early December to support the bullish case. With no clear signs of a recession this is still the favored scenario but a drop in A/D lines below the recent correction lows would be more negative. The horrible events in Paris could make investors even more nervous on Monday.
I will be monitoring the market action this week closely and will share my market thoughts during the week on both Twitter and StockTwits.
Comments
comments