

The major averages, based on their starc band analysis, reached high risk sell levels with last Friday's close so Monday's bounce was not surprising. The A/D ratios were less than 2-1 positive which in my view was not strong enough to confirm a short-term low. The overall market needs a stronger up day in order for the Dow Industrials and S&P 500 to make new highs for the year.
As I pointed out last weekend "Potholes On The Value Path" the Nasdaq 100 A/D line had broken support and was on the verge of starting a new daily downtrend. In contrast the S&P 500 A/D line has turned up from its rising WMA and unlike the Nasdaq 100 is well above daily support.
The Spyder Trust (SPY) needs a close above $209.81 to signal a move back to the April 20th highs and possibly higher. Conversely a drop below $205 will make the support at $202-$203 the next likely target. This corresponds to monthly pivot and chart support. The S&P futures are down over 0.6% in early trading while some of the Euro zone markets are down over 1.5%. Of course, it is the daily close that will be more important.
Some analysts have become more bullish on US automakers Ford Motor Company (F) and General Motors (GM) including a Barron's cover story "General Motors and Ford Shares Have 25% Upside". For many years I have made the case that the analysis of the monthly charts can give investors an advance insight on the major trends. After April's close what do the technical studies say about the major trends for Ford Motor Company (F), General Motors (GM) or Tesla Motors (TSLA)?
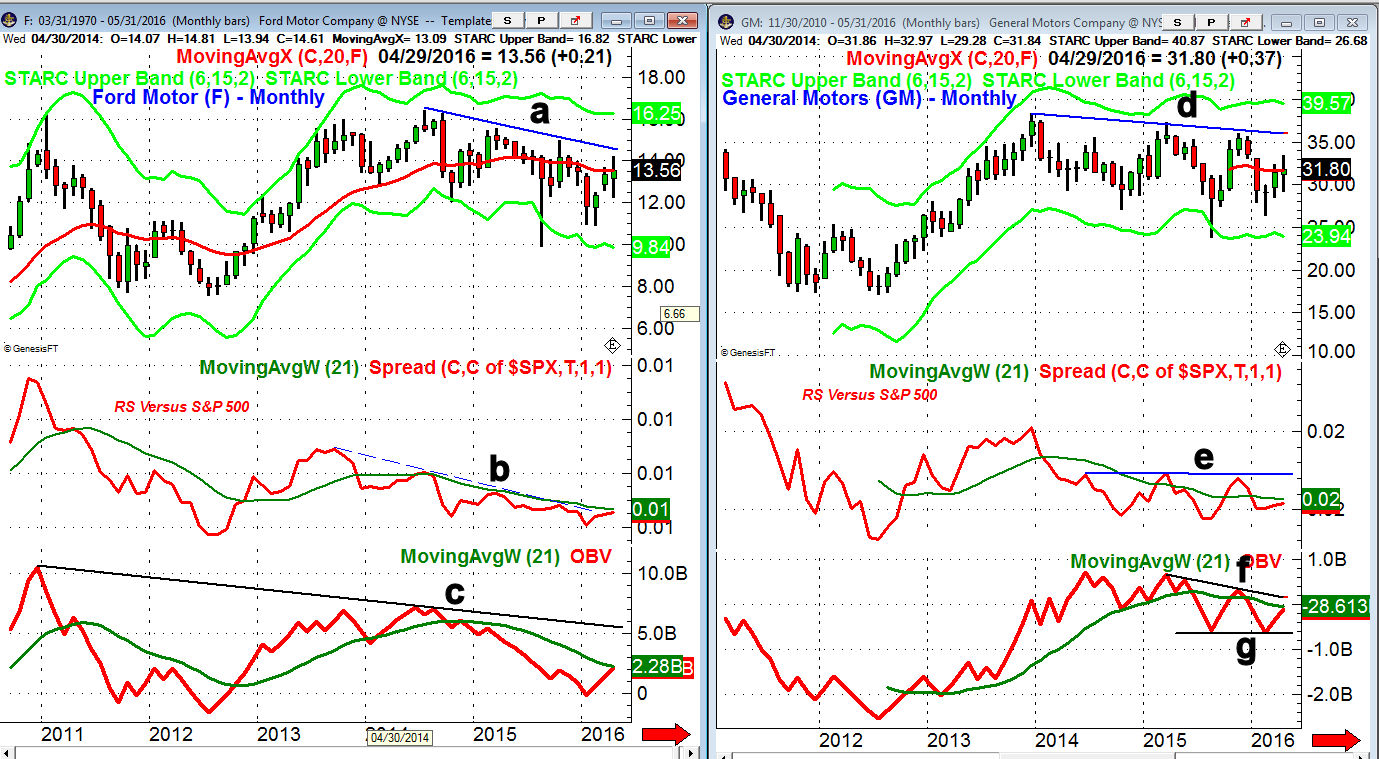
Ford Motor Company (F) is up just 0.6% YTD versus a 2.5% gain in the Spyder Trust (SPY) and it was down over 5% in 2015. The April close was just above the 20 month EMA at $13.54.
- The monthly downtrend, line a, is in the $14.50 area with the late 2015 high at $15.
- The quarterly pivot stands at 412.84 with the April low at $12.25
- The relative performance is just below its downtrend, line b, and the declining WMA.
- The monthly OBV could move back above its WMA in May but is well below the long-term downtrend, line c.
- The weekly technical studies are positive with the OBV looking fairly strong.
General Motors Company (GM) is down 5.5% YTD but was up slightly in 2015. There is quarterly pivot resistance at $34.41 with the monthly downtrend at $36, line d.
- GM spent the 1st quarter below its pivot but now it is above the 2nd quarter pivot at $30.55
- There is monthly support first at $28.56 with more important at $26.36 which was the February low.
- The monthly relative performance is below its WMA and needs to overcome the resistance at line e, to signal that it is a market leader.
- The monthly on-balance-volume (OBV) shows a potential bottom formation, line g.
- The OBV needs to overcome the downtrend and its WMA to turn bullish.
- The weekly studies are still range bound and not impressive so a drop below $29.18 could trigger heavier selling.
Tesla Motors Inc. (TSLA) is up just 0.75% YTD and was up 7.9% in 2015. The quarterly pivot resistance at $266.09 was hit in early April as TSLA formed a short term top.
- The April close was well below the month's high with first support at $219.53 and the 20-month EMA.
- The quarterly pivot stands at $203.57 with the February low at $181.50.
- There is long term monthly support now at $141, line b.
- The monthly relative performance has moved back above its WMA which is a positive sign.
- I would expect the RS line to breakout above the resistance at line c, before prices.
- The monthly OBV has completed its bottom formation as it has moved above its WMA and the resistance at line e.
- TSLA has corrected for several weeks but could test the 20-week EMA at $225.84 before the correction is over.
What's Next? The monthly technical outlook currently does not suggest that either Ford Motor Company (F) or General Motors (GM) is ready for the 20% gain that some are expecting. This could change in the next few months and the weekly analysis on Ford Motor Company (F) does look the best.
Tesla Motors Inc. (TSLA) came up on the Viper Hot Stocks scan at the end of March and the weekly doji in early April favored a correction which I am monitoring closely. The stock is down 3% in early trading and they report earnings after the close on May 4th.
Comments
comments