

The selling Monday was well absorbed as all the major averages closed well off the day's lows. This set the stage for Tuesday's powerful rally. The technical picture started to change on December 22nd as the technical tools that measure the advance/decline data were turning bullish. As noted in the 12/22 Tweet the McClellan oscillator has broken its downtrend from the October highs.
So far few analysts seem impressed by the action this week but the advance/decline lines on the Nasdaq 100, NYSE Composite and S&P 500 are now acting stronger than prices. The lack of enthusiasm from Wall Street and the relatively low individual bullish sentiment (26.3% according to AAII) will allow the market to move significantly higher. Let's look at the charts.
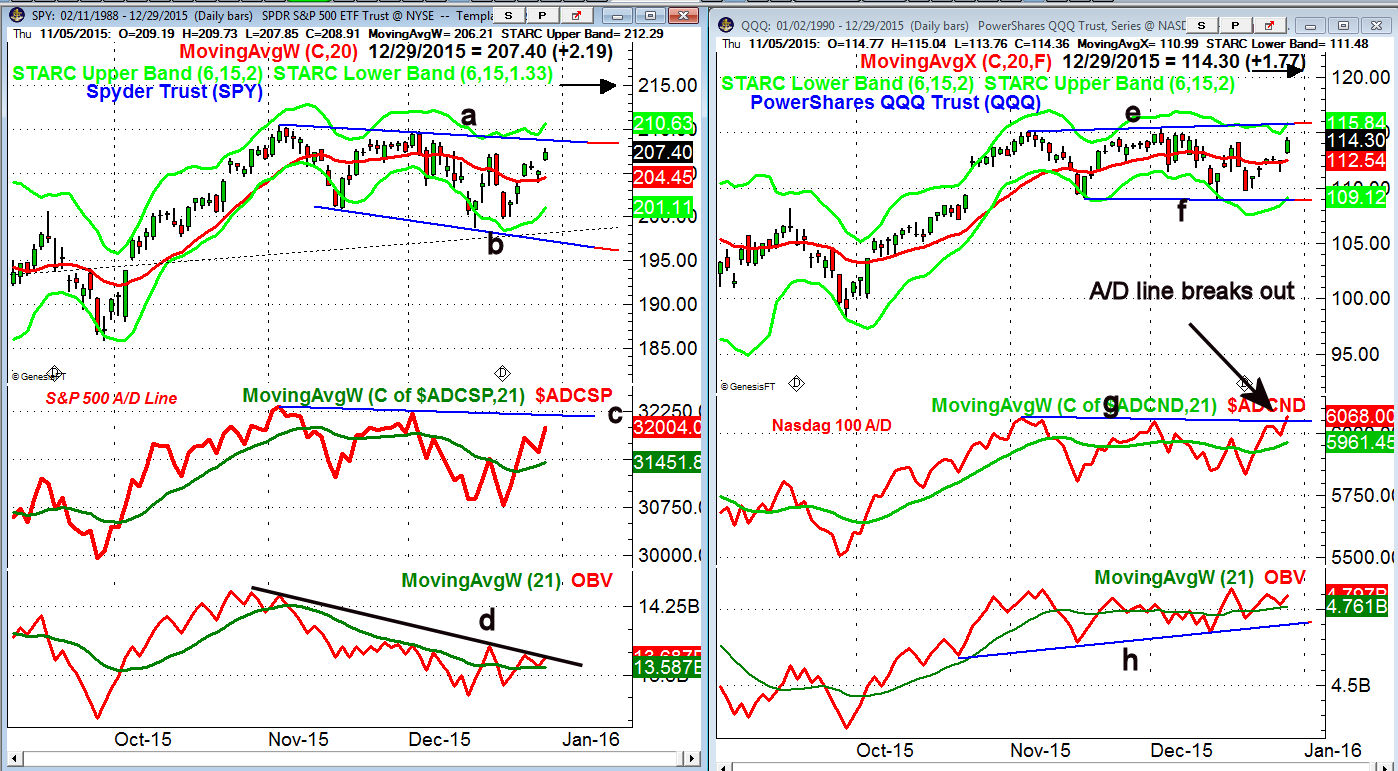
The Spyder Trust (SPY) just dropped back to its 20 day EMA on Monday creating a good buying opportunity. The post FOMC rally high of $207.25 has now been overcome which is a positive sign.
- The flag formation, lines a and b, has key resistance in the $208.80-$209.60 area.
- Initial upside target at $215 while an upside breakout has targets in the $218-$220 area.
- The S&P 500 A/D line is in a bullish short term uptrend after Monday's slight pullback.
- The A/D line is already close to the early December highs and should overcome resistance at line c, by early 2016.
- The daily on-balance-volume (OBV) is still lagging prices but is now testing its downtrend, line d.
The weekly OBV (not shown) has been positive since early October.
The Powershares QQQ Trust (QQQ) is acting stronger than the S&P 500 as the relative performance(RS) has identified it as a market leader all year. I just posted a new video on RS analysis which can be found on You Tube. The QQQ dropped down to my initial support zone on Monday before gapping higher Tuesday.
- There is next resistance at $115.40-$116, line e.
- A close above this level will complete the trading range (lines e and f) with upside price targets in the $120-$122 area.
- The Nasdaq 100 A/D started to lead prices last week signaling that any pullback should be well supported.
- The A/D line broke out to the upside on Tuesday as resistance at line g was overcome.
- This is provides strong bullish evidence that prices will also breakout to the upside.
- The OBV is also close to making new highs as it held above support on Monday.
What to do? The futures are a bit lower before the opening and while the market may digest its recent gains over the next day or so any weakness will be a buying opportunity. The Health Care Sector Select (XLV) also broke out on Tuesday.
It would take several days of heavy selling and quite negative A/D numbers to turn the outlook back to negative.
Editor's note: If you like Tom's analysis and want specific entry/exit advice on ETFs check out Viper ETF Report his premium newsletter.
Comments
comments