

As investors and traders head into the long Memorial Day weekend the S&P 500 is once again close to the April highs and the widely watched 2100 area. This is despite the raft of negative headlines that filled my inbox this week, including: The Market Is In For A Shock, A Market Under Pressure, Prepare For A Recession and The Recent Rally May Be A Head Fake.
It appears that many hedge funds and banks are short the stock market as they are looking for another rally failure. In last week's column "Avoiding The Big Money Blues" I pointed out the hazards of following the hedge funds or well known money managers. Often when a majority of these big traders are on one side of a trade the market goes in the opposite direction. Last week's action in gold was a good example.
There were early signs from the market internals last week that the recent trading was not going to lead to a sharper correction and a new rally phase was more likely. The evidence was strong enough for me to recommend that Viper ETF traders buy several ETFs that ended sharply higher.
This end of the correction was confirmed last week ( Uncovering Best Of Breed Stocks) as the Nasdaq 100 A/D line "moved above its WMA and the May 10th high". As stocks continued higher through the week the technical studies have gotten even stronger. (See Market Wrap section)
Surprisingly, despite the strong stock market only 17.8% of individual investors are bullish according to AAII who pointed out "This is the lowest level of optimism recorded by our survey since April 14, 2005". The very high neutral reading also goes back over 16 years. So what fears are keeping investors from buying stocks?
Many investors are again worried that the Fed will raise rates again this summer as comments from some Fed governors early in the week sparked more speculation. On Friday afternoon comments from Fed Chair Janet Yellen that it was "appropriate to gradually start raising rates" as further convinced many investors.
Many investors believe the popular misconception from the general media that higher rates are immediately bad for stocks. What they miss is that there is historically a long lead-time between when rates start to rise and before stocks actually top out.
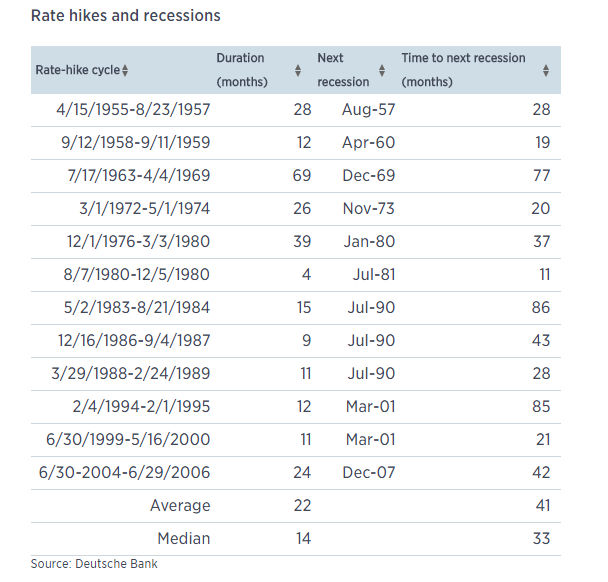
This table from Deutsche Bank details all of the rate hike cycles doing back to 1957. It reveals that on average it takes 41 months from beginning of a rate-hike cycle before a recession starts. As I pointed out in a previous Week Ahead column when rates were raised on June 30, 2004 the stock market continued higher until October 2007 and the recession started in December.
There was another rate hike cycle that began on February 4, 1994 with the S&P 500 at 469. This cycle only lasted until February of the following year but the S&P 500 stayed in a trading range and was unchanged for the period. In fact, the early stages of a higher rate cycle can be a bullish period for stocks.
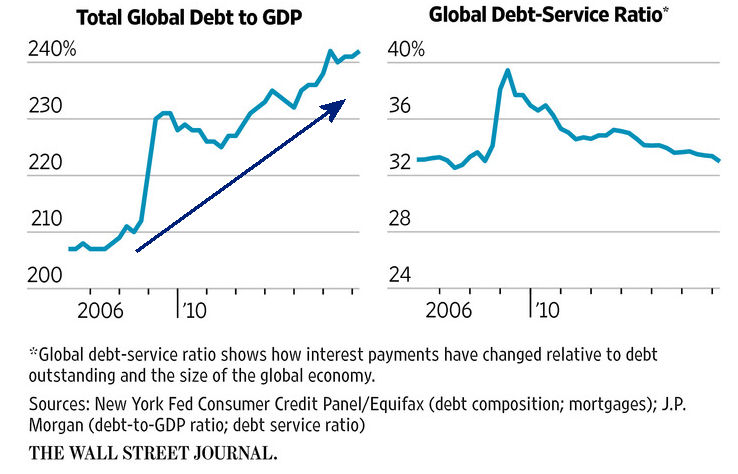
Another major concern of investors is the new high in global debt as well as the sharp increase in corporate debt over the past few years. This was discussed in an excellent article in the WSJ and the chart shows a solid uptrend (my annotation) and the series of new highs. It is positive that because of declining interest rates the global debt-service ratio is well below the 2008 high as according to J.P. Morgan the "cost of interest payments, as a share of GDP, has fallen to 7% from a peak of 11%" in 2008.
This could change in the next few years if rates do indeed move higher. In China the debt to GDP ratio has increased 80% since the recession but their debt service ratio has not changed in the past two years. Of course not all debt is the same as most realize that student debt has doubled in the past six years and there is much debate about the quality of some of China's debt.
Some investors have been avoiding stocks since they have been told for the past two years that stocks were expensive and should not be bought. This is a regular argument from some perpetual bears and at some point they will be right. They argue that the P/E or Price/Earnings of stocks is at historically high levels. Some point to the Shiller CAPE Ratio (Cyclically Adjusted PE Ratio) developed by Yale professor Robert Shiller who won a Nobel prize for his work.
Fellow academic Jeremy Siegel is one of many to question his approach even though they have been long time friends. It has been noted that this model was negative in May 2009 and according to an article in Financial Advisor it has signaled that stocks have been overvalued for much of the past 35 years.
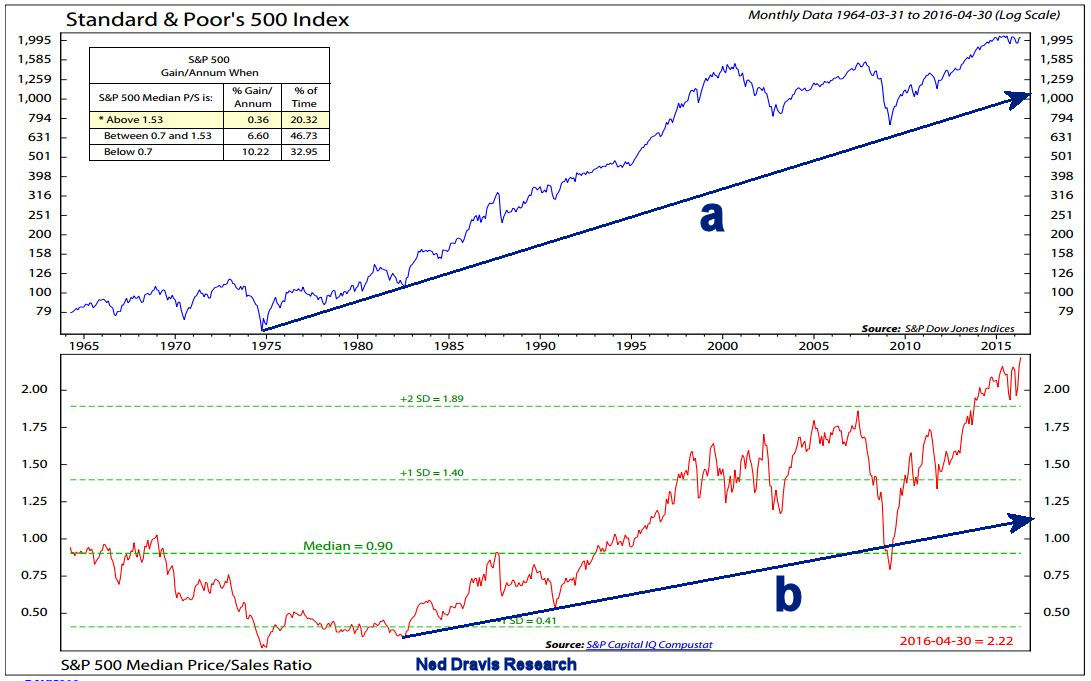
As a technical analyst I am suspicious of any conclusions based on earnings or other financial data as I have found the price and volume action to be a better determinant of value. I would argue that the technical studies will top out well ahead of the earnings data as was the case in 2007. Some also point to the Price/Sales data that is featured in this chart from Ned Davis.
My annotation on the chart points out that the major trend in the S&P 500, line a, is clearly intact. Also even though the support in the Price/Sales (line b) was broken in 2008, the new highs in 2013 reaffirmed the positive overall trend. Some well known bears have been using this data since 2014 as a reason that the market cannot continue higher.
The sharp stock market decline in early 2016 had many fearing a new recession as articles supporting this view dominated the press at the start of the year. Since early in the bull market I have not believed the fears of a new recession and often times these fears have peaked at correction lows. I have remained positive on the economy based in part on my favorite indicator, the Conference Board's Leading Economic Index (LEI).
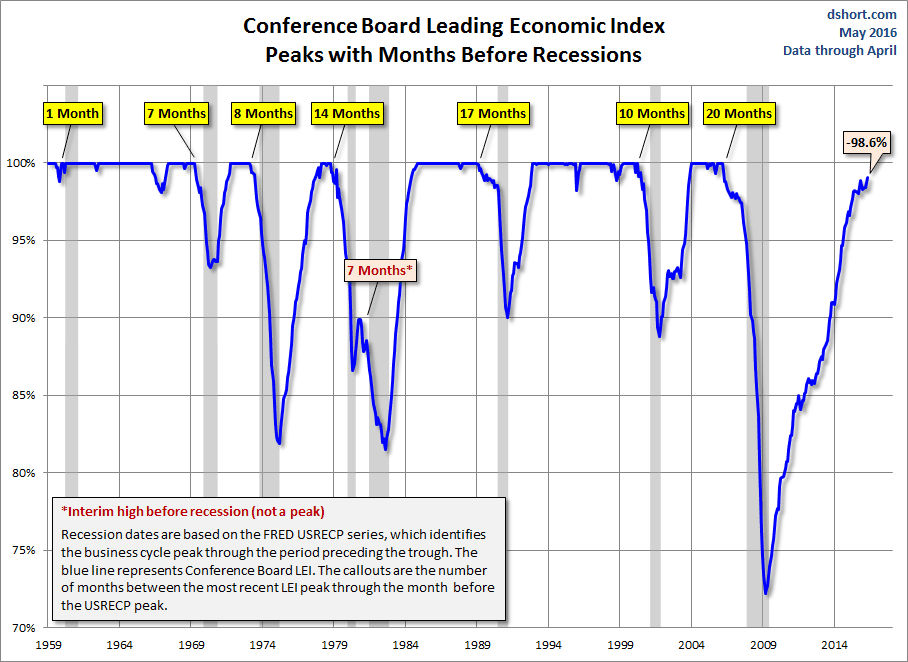
The most recent chart of the LEI was featured last week and it has an excellent record of peaking out well before the start of a recession. Some excellent work on the LEI has been done by Doug Short and this long term chart shows how this measure of the economy has consistently peaked well ahead of a recession. The positive April LEI data has reaffirmed the overall uptrend.
These I believe are the four most common fears that are keeping many investors out of the stock market. It will likely take much higher stock prices before the sideline investors decide to buy stocks.
The Economy
The week started off on a disappointing note as the flash reading on the PMI Manufacturing Index came in at 50.5 which is just above the key 50 level. This Wednesday we get the more important ISM Manufacturing Index and the PMI Manufacturing Index. The Richmond and Kansas City Fed Manufacturing data are still weak as both are still in negative territory.
The New Home Sales came in at the highest level since January 2008 which was a monthly surge of 16.6%. On Thursday the Pending Home Sales Index was up 5.1% which was the third gain in a row. This coincides nicely with the technical outlook for the home building ETFs which were looking positive as the week started and have has been recommended to Viper ETF clients.
The flash reading on the PMI Services Index last Wednesday was down from the prior month and at 51.2 is just barely above the key level of 50. On Thursday the Durable Goods came in at an impressive 3.4% which was much better than the consensus estimates of 0.3%. Inside the capital goods component did drop for the third month in a row so this will bear watching in the weeks ahead.
Friday's 1st quarter preliminary reading on 1st quarter GDP at 0.8% showed some improvement over the advance reading. Corporate profits were down 3.6% in the first quarter matching the decline in the 4th quarter of 2015.
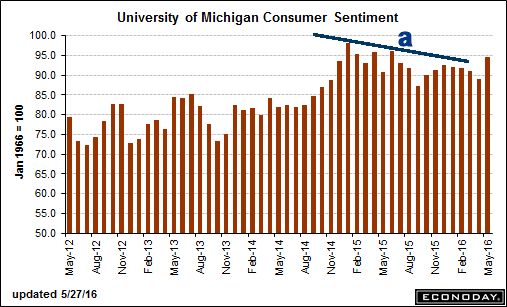
The month ending Consumer Sentiment at 94.7 was pretty much what the market was expecting. It is up a strong 5.7 points from the April report which breaks the pattern of lower highs. The increase in expectations implies confidence in the jobs outlook.
Even though we have a holiday shortened week there is plenty of data ending with the monthly jobs report on Friday. A good number, in the view of many, will increase the odds of a Fed rate hike in June or July.
There are other key reports this week as on Tuesday there is the Chicago PMI , Dallas Fed Manufacturing Survey, the Case-Shiller Housing Market Index and Consumer Confidence. In addition to the PMI and ISM Manufacturing data on Wednesday we get the corresponding services indexes on Friday along with Factory Orders.
Interest Rates & Commodities
Interest rates showed little change last week despite the GDP report and the comments from the Fed Chair as the recent trading ranges are still intact. No clear signs yet of a breakout despite the apparent growing opinion the rates will be hiked this summer.
Last week I cautioned about the risks on the long side of the precious metals and the miners. This was based on the negative technical readings and large long position by the hedge funds. The gold futures were down $39 for the week while the Market Vectors Gold Miners (GDX) was down over 7%. The strong volume that accompanied the precious metals bottom early in the year suggests that an important low was likely formed so I am looking to get back on the long side once the correction runs its course.
Crude oil continued higher last week as the $50 level basis the July contract was overcome during the week. The weekly studies are still positive but a doji was formed on Friday so I would not rule out a sharp pullback in the next week or two.
Market Wrap
The technology stocks led the market higher has week as the S&P 500 Technology sector was up 3.6% for the week clearly outpacing the 2% gain in the Dow Industrials and S&P 500. The better than expected GDP data on Friday did calm the markets. Euro zone stocks were also strong as the Stoxx Europe 600 gained 3.4%.
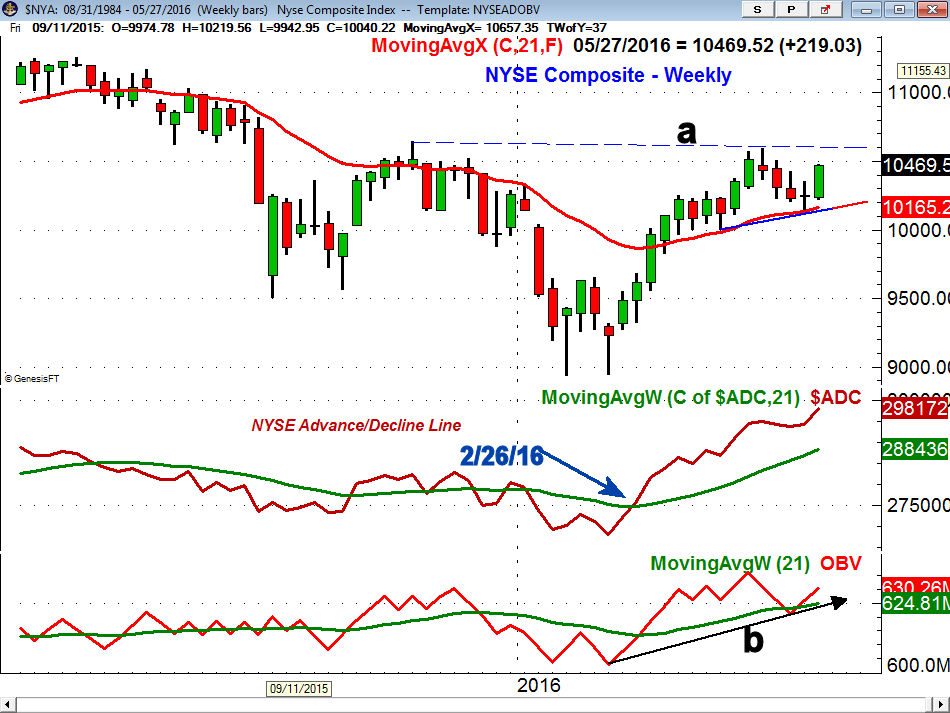
The market internals were very strong with 2482 stocks advancing and just 695 declining. This has pushed the NYSE A/D line to another new rally high. As I noted at the end of February the move in the A/D line above its weekly WMA was a bullish sign for the intermediate term. The shallow nature of the recent pullback in the A/D line is also a sign of strength.
The fact that the A/D line has already moved well above the late 2015 highs suggests that prices will follow and move the NYSE resistance at 10,600, line a. The May 2015 high at 11,254 should eventually be overcome which means a rally of 7.5% from Friday's close.
The weekly OBV has moved solidly above its WMA with important support at the recent low and the uptrend, line b. The monthly OBV is currently above its WMA and a monthly close above it would be another positive sign.
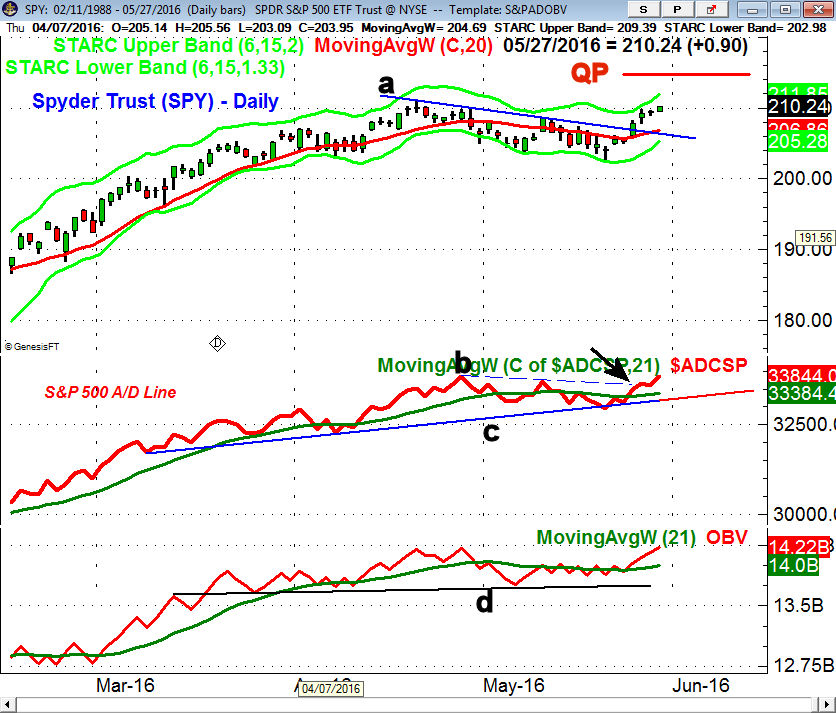
The Spyder Trust (SPY) broke through its downtrend, line a, last Tuesday though the ranges narrowed late in the week. On a move above the April 20th high of $210.94 the quarterly pivot resistance is at $214.61 with the weekly starc+ band at $217.08.
There is initial support now at $208.50 with the rising 20 day EMA. The S&P 500 has broken its downtrend, line b, but is still barely below its April high. The weekly A/D line (not shown) has moved strongly above its prior high and is acting much stronger than prices. The daily OBV has moved above the April highs and is starting to act stronger than prices.
As I noted last week the Powershares QQQ Trust (QQQ) was starting to act better than the SPY as it triggered a daily doji buy signal on Friday May 20th. The very favorable risk/reward analysis favored new buy recommendation in the QQQ for Viper ETF traders. The entry strategy, explained in a trading lesson on entry levels, targeted an entry price very close to the week's lows.
There are a large number of stocks in both the Nasdaq 100 and IBD Top 50 that are likely to give new buy signals in this weekend's Viper Hot Stock scans. I will also be focusing on those stocks that will give new monthly buy signals next Wednesday.
What to do? The strong action early last week moved the A/D line analysis from the corrective to the positive mode. This is a sign that the market is just starting a new rally phase and the low level of investor bullishness should be another positive for the stock market. It think the hedge funds and debt focused traders still favor the short side and I think they well be disappointed.
I would expect the stock market to correct next week and one sharp down day could give the bears some hope but I think it would be a buying opportunity. There are a number of ETFs and stocks that will look attractive on a pullback. I am looking to add to positions at levels where the risk can be well controlled.
For investors a pullback of 1-2% should be an opportunity to buy a well-diversified U.S. or global ETF that has a low expense ratio. I am also looking at some of the ETF that concentrate on the Euro zone markets as they are also starting to act better.
Over the past thirty years I have focused on educating new investors and traders as I feel those who are willing to study and do the work can be successful. if you are interested in learning more subscribers to either my Viper ETF or Hot Stocks service get regular trading lessons that are designed to both educate and train my subscribers. New subscribers are also sent the four most recent trading lessons with their $34.99 monthly subscription.
Comments
comments