Editor's note: If you like Tom's method of analysis and want specific entry/exit advice on ETFs check out the Viper ETF Report his premium newsletter.
Since the second week of November most of the major averages and many of the most liquid ETFs have been in trading ranges. The PowerShares QQQ Trust (QQQ) for example had a November low of $111.15 followed by a rally above $115 that was followed eight days later by a test of the November lows. The daily price formations in the QQQ and many other markets have not presented many good swing trading opportunities.
Everyone has their favorite swing trade setups and I have had the best success identify a low or high that will results in a market move that lasts 6-8 weeks. If I am fortunate this will present more than one good swing trading opportunity.
The recent sharp swings have only allowed very short term opportunities. One of the recent swings in the Spyder Trust (SPY) illustrates this point. The SPY had a low of $198.77 on December 14th but rallied to a high of $207.25 on the morning of December 17th before dropping back to $200 by the close on the following day. Just five days later it came close to $208.

This was not the case earlier in the fall as there were quite a few good swing trading setups. One example was in the Wisdom Tree Japan Hedged Equity (DXJ). On Tuesday September 29th DXJ formed a doji (see circle) which was a sign of indecision. The following day DXJ closed at $48.65 well above the doji high of $48.01. This triggered a short term buy signal.
The following day (October 1st) the OBV broke through its resistance confirming the buy signal, line 1. A reasonable entry would have been in the $48.25-$48.50 area with a stop at $47.17 well under the doji low. This would have meant a risk 2.4-2.8%.
On October 2nd DXJ opened lower at $48.25 dropped to $48.05 before closing at $49.69. The target for the trade was the $52.18 high from September 17th, line 3. On October 9th DXJ opened at $52.29 and also ended up forming a doji. The setup allowed for a 7+% gain in just a week. I normally look for swing trades that last 4-8 days.
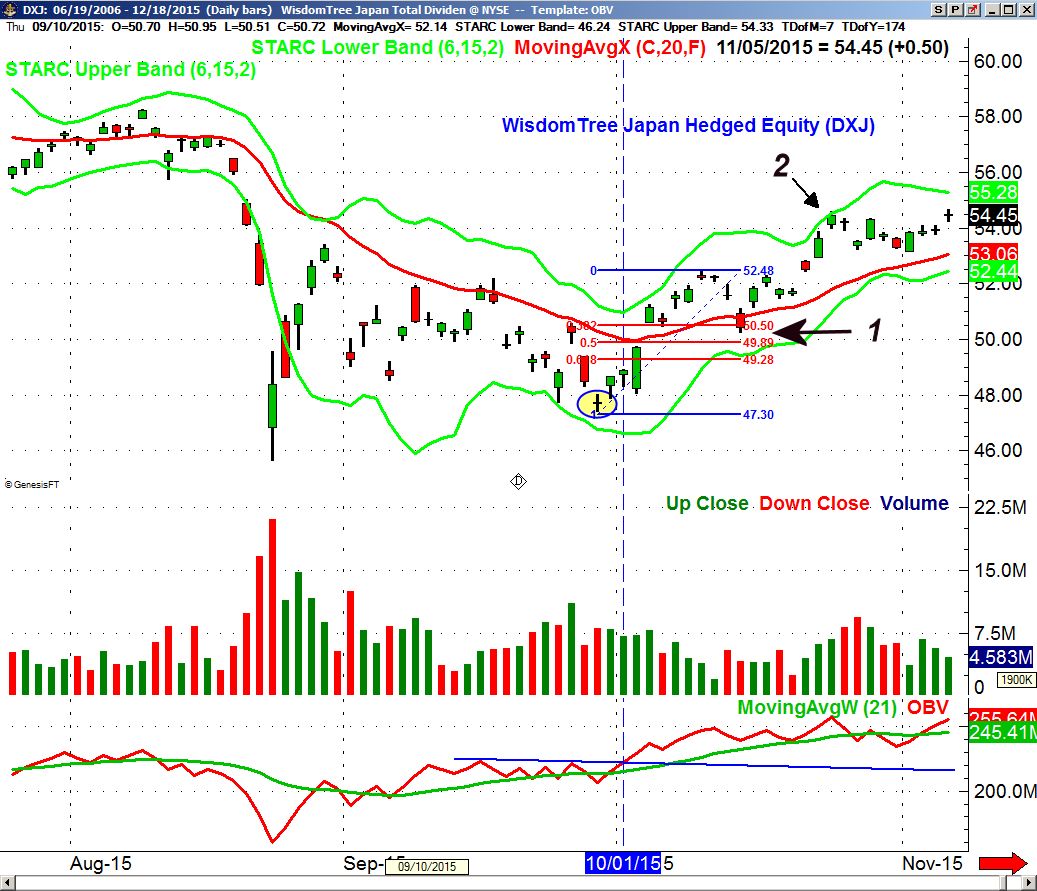
The daily studies, like the OBV, were still positive so buying a pullback was a reasonable strategy. The 20 day EMA was at $50.79 while the 38.2% Fibonacci support of the prior rally was at $50.50 with the 50% support at $49.89.
I have found that retracements within an uptrend will often find support between these two support levels as the mid-point was $50.19. The daily starc- band was at $49.42 with the 61.8% retracement support at $49.29 so a stop at $48.88 was reasonable. This would have meant a risk of 2.6%.
If a rally from this correction low equaled the prior rally then the 100% target was at $55.30. DXJ dropped on October 14th to a low of $50.23 (arrow 1) but gapped higher the next day suggesting that the rally had resumed. By October 19th the stop could have been safely raised to under the October 14th low.
On the fifth day after the entry DXJ gapped higher and on October 23rd, point 2, closed above the daily starc+ band (point 2). Those of you who are familiar with my use of this indicator (One Of My Favorite Chart Tools of All Time) know that when a market is at the starc+ band it is a high risk buy and a low risk sell. When I am in a swing trade and a market reaches its starc band or forms a doji, I look to take profits on my position. DXJ eventually hit a hit of $55.80 on November 18th.
I am expecting to see a number of excellent swing trading opportunities in 2016.
Comments
comments