

The stock market had another very strong week as the Spyder Trust (SPY) is already getting close to the next upside target in the $218-$220 area. Many media traders and investment banks are looking for another weak earnings season but last week's numbers had some positive surprises.
In the next two weeks we will get a better idea but since May I have been looking for better than expected earnings. This is diametrically opposed to Goldman Sachs who commented a week ago that " A worse-than-expected earnings season especially for banks and Apple will cause the S&P 500 to pull back 5 to 10 percent from its current all time high".
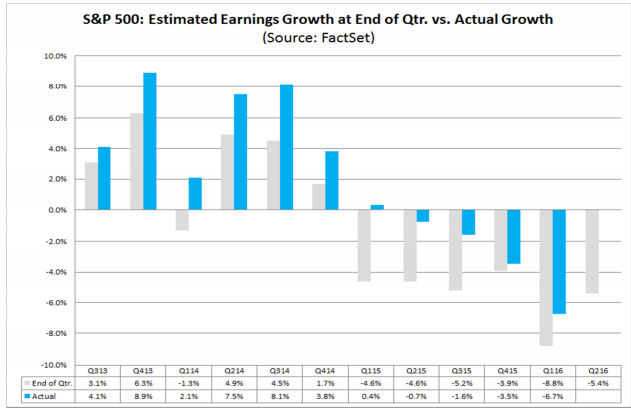
The data since 2013 suggests that fundamental analysts have not done well in forecasting earnings. This chart from FactSet shows that the actual earnings (in blue) have consistently been stronger than their estimates. For example, in 2014 earnings were positive but came in stronger than estimated. Over the past five quarters the estimates have been negative but earnings have not been as weak as were estimated.
This week we have IBM, Bank of America, Goldman Sachs, Johnson & Johnson, Microsoft , United Health , Intel and Starbucks just to mention a few. My favorite earnings calendar is on Morningstar. These stocks and others next week may set the tone for the rest of the earning's season.
Many of the financial pundits and writers spent considerable energy last week trying to explain the new highs in the S&P 500. As was the case the previous week most expressed disbelief or argued why the rally must end soon. It is important for an analyst to keep an open mind when analyzing the markets as failing to continually question your conclusions can lead to disaster.
In last week's column I tried to point out that most of the bearish analysts do not provide any guidelines for what it would take in order to change their outlook. . I think you always need an exit strategy as everyone is wrong at some point. Some comments suggested that some clarification would be helpful.
If you are bearish on the stock market because the price/sales data or margin debt is too high then it would seem that only sharply lower numbers could change the negative outlook. If instead these numbers move even higher how or when does one determine that they were wrong?
The same argument would apply to a concern over too high P/E ratios as if the earnings do get better, prices are also likely to also move higher which could leave the ratios pretty much unchanged. My regular analysis of the advance/decline lines allows me to identify clear levels of support . A violation of these levels is needed to change my daily, weekly or monthly bullish outlook.
As the market moves even higher those who are not long or are short have to work even harder for new bearish arguments. One argued that the current environment was like 1987 even though he pointed out that "the current dollar environment, as well as interest rate environment is quite different."
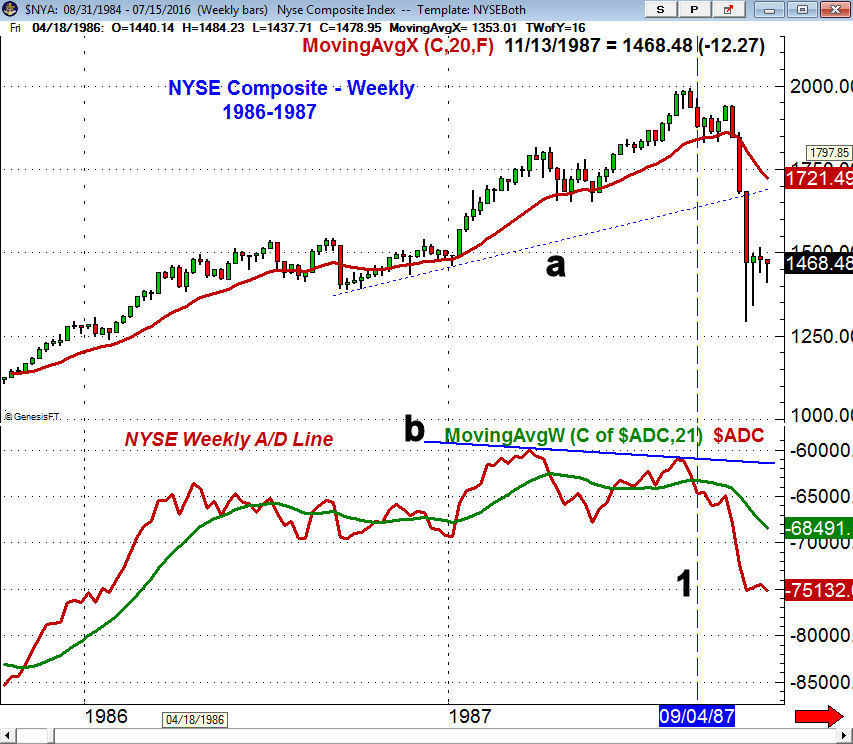
The technical picture is also much different as the weekly NYSE Advance/decline line peaked in March 1987 and then formed a pronounced bearish divergence, line b, at the August 1987 high. Two weeks after the closing weekly high the A/D line dropped below its WMA and was in a new downtrend weeks before prices collapsed below the support at line a.
Much has been made of the fact that some of the best known and high profile money managers like George Soros, Carl Icahn Bill Gross, and Jeffrey Gundlach were negative on the market before the recent rally. They are considered to be some of the smartest guys but data suggests that following the so-called "smart money" may not be the best idea.
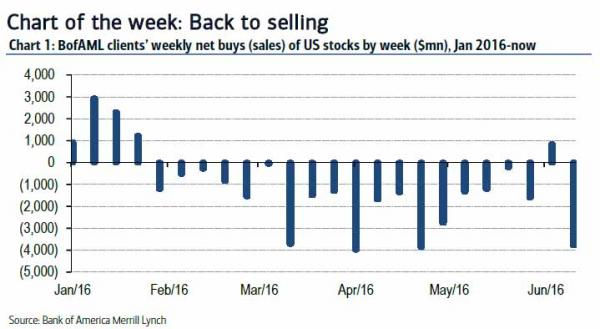
Client data from the Bank of America shows that their smart money (includes hedge, institutional and private clients) have been net sellers for most of the year. The one week of buying in June broke a streak of 19 consecutive weeks and apparently the institutional clients were the biggest sellers. It will be interesting to see new data in the next few weeks to see what they have been doing since the jobs report.
So if it wasn't the smart money that pushed the market higher, what did? The craziest arguments as to why the market surged was reported by Art Cashin who has demonstrated his excellent understanding of the markets for decades. In last week's report, titled "Conspiracy Theories Grow Among Frustrated Shorts" he discussed that some frustrated wrong way option traders were blaming their losses on a conspiracy .
The option traders who have been short are pointing to manipulation in the overnight futures session. They feel that it is somehow tied to the central banks and the Brexit vote as they complain that the sharp overnight moves limited their trading. The interesting part is that if you look at an intra-day chart many of the sharp overnight moves were followed by periods of consolidation that allowed one to enter the market with reasonable risk prior to the next overnight rally. It should also be noted that for many years higher stock prices in Asia and Europe have caused the futures to open strong in the US.
These two excuses for missing the rally just go back to the old saying that the market will do whatever it takes to prove the majority wrong. For those who believe that the stocks market can go higher, what are the reasonable upside targets?
In the Viper ETF Report last month I pointed out that the initial upside targets from the Spyder Trust (SPY) were in the in the $218-$220 area, at $190-$192 for DIA and $118-$120 for IWM. The strong readings from all of the A/D lines made the reward worth the risk in buying these ETFs ahead of the jobs report.
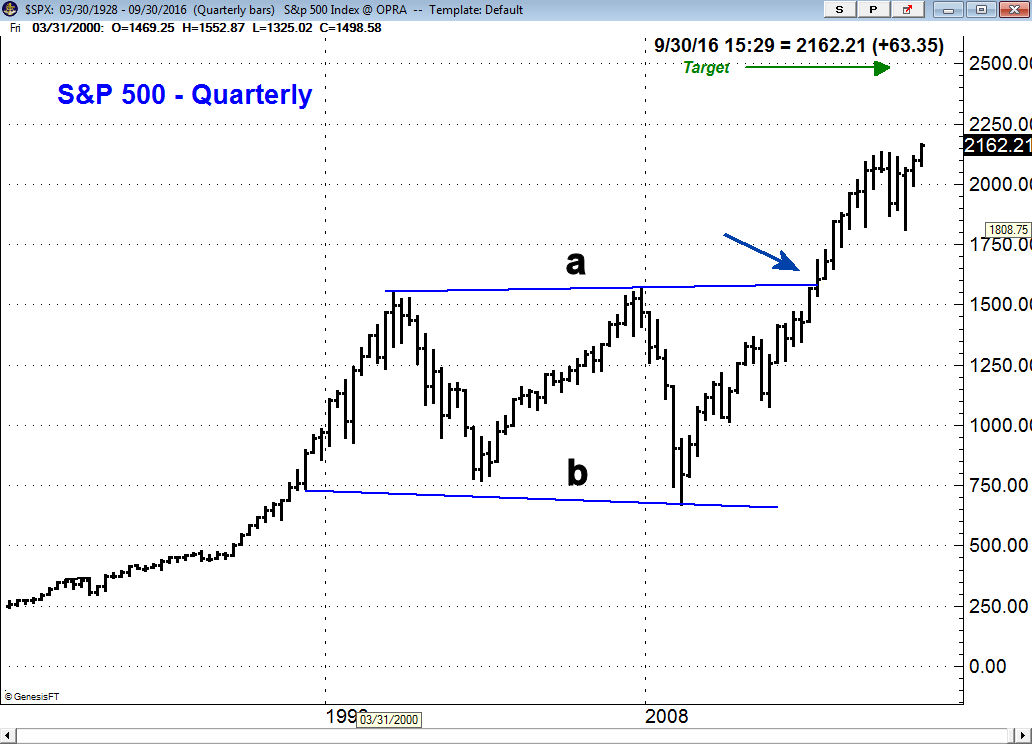
The SPY high last week above $217 means it is already close to the first target so what's next? As I mentioned in my June 18th discussion of the long term S&P 500 chart I felt that breakout of the major trading range in 2013, lines a and b, was more significant that the yearlong trading range that many believed was a major top. The completion of the trading range has major upside targets in the 2400-2500 area or $240-$250 in the SPY.
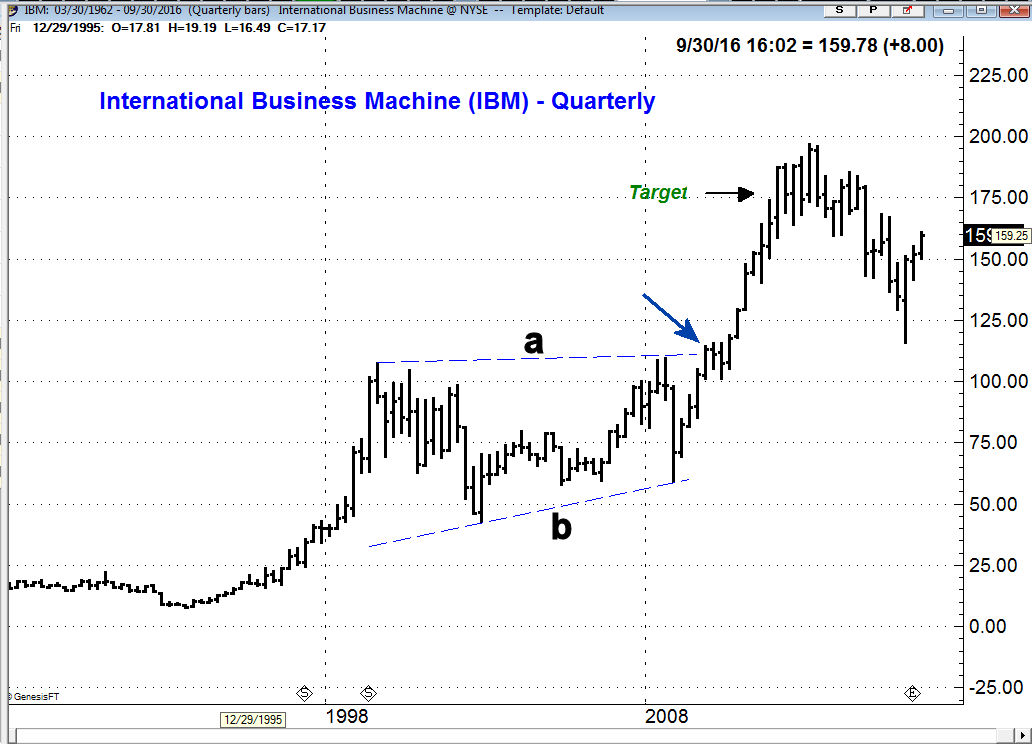
As many of you know the signals from the long-term charts are the most reliable. In 2011 I wrote about International Business Machines (IBM) which had completed a ten year trading range, lines a and b. The width of this range was just over $67 and when added to the breakout level at $110 this gave you an upside target in the $176 area. This target was met two years later during the first quarter of 2013. IBM eventually reached a high of $197 before beginning a three-year correction.
The March 2012 completion of a major trading range in the Health Care Sector made it my favorite for several years as it was up 17.4% in 2012, 41.4% in 2013 and 25% in 2014. This is one of the reasons why I carefully study the monthly charts and some of the sector ETFs that I follow in the Viper ETF Report are could see major breakouts in the next month or so.
Of course I always look at the market one-step at a time and if there are signs from the A/D analysis that we are going to see a 5-8% correction after reaching the $224 or $230 level I will definitely look to take profits.
Economy
The Producer Price Index was up 0.5% in June which was higher than expected and then on Friday the Consumer Price Index was unchanged from May. Retail Sales in June were up sharply to 0.6% which reflected nice gains in building materials, department stores and sporting goods.
Also on Friday the Empire State Manufacturing Survey was weaker than expected but Industrial Production beat estimates. The mid-month reading on Consumer Sentiment showed a sharp decline of 4 points to a very low 89.5 as there was a significant drop in expectations.
The focus this week is on the housing market with the Housing Market Index on Monday followed by Housing Starts Tuesday and then Existing Home Sales on Thursday. The Philadelphia Fed Business Outlook Survey is out on Thursday as is the Chicago Fed National Activity Index and the Leading Economic Indicators. On Friday we get the flash reading on the PMI Manufacturing Index.
Interest Rates & Commodities
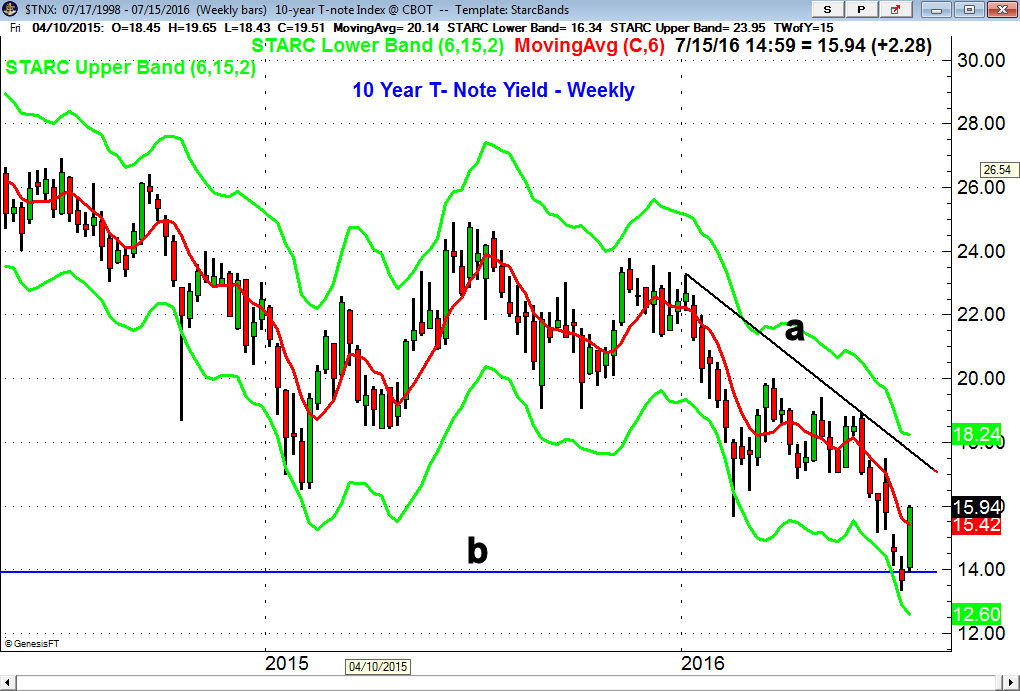
As I mentioned last week the yield on the 10 Year T-Note was very oversold as they closed very near to to the weekly starc- band (see arrow). The yield had dropped below the 2012 low, line b, and closed a week ago at 1.366%. The chart shows that yields were up sharply this week closing at 1.594%. In reaction to the political unrest in Turkey rates have dropped a bit after the close. Yields are still well below the initial weekly downtrend in the 1.760% area, line a.
Crude oil had a choppy week but ended a bit higher. The daily studies are trying to bottom out but the September contract needs a close above $47.70 to turn this market higher. Gold was lower last week as the selling was heavy as the week started. The long side of gold is still very crowded so I expect any bounce to be short lived.
Market Wrap
Despite the prevailing skepticism it was another week of solid gains for the stock market with the Dow Transports up close to 4% followed by a 2.4% gain in the small cap Russell 2000. The large cap Dow Industrials were up 2% and led the S&P 500 as it only gained 1.5%. The market internals were again very positive as advancing stocks led the decliners by a 2 to 1 margin.
Basic materials led the sectors last week up 4.3% followed by a 2.5% gain in the financial stocks as there were some positive earnings big bank earnings that surprised the market. Technology, oil & gas and industrial stocks were also up over 2% while health care lagged only gaining 0.5%. The overextended utility stocks lost 0.9% on the week.
The individual investors became more bullish last week according to AAII as 36.9% are now bullish up 5.8% while the bearish % dropped 2.2% to 24.4%. The bullish% is still below the long term average. It is difficult to get a hard reading on the professional sentiment and as I have always stressed the sentiment readings must be viewed in the context of the technical readings.
In the first half of the year only 18% of large cap managers beat the Russell 1000 and Bank of America commented that this was “the worst year for active managers” since at least 2003. This is a measure of their sentiment for the first half of the year.
In listening to the TV pundits and reviewing much of the market commentary the majority are still bearish. When you combine this with the current strong technical readings it continues to favor further gains.
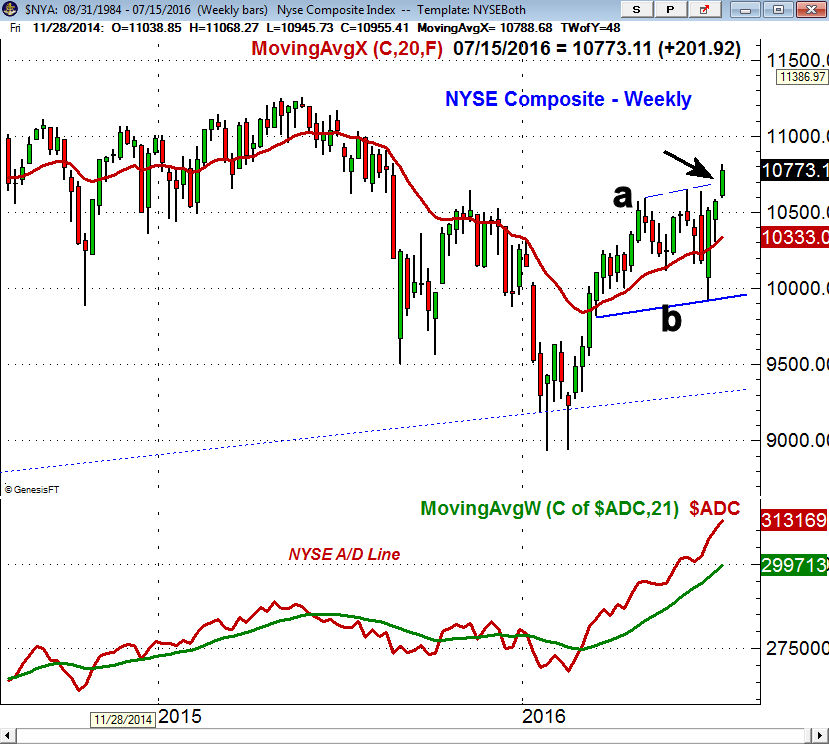
The weekly chart of the NYSE Composite shows that it closed the week above the resistance at line a. There is next resistance in the 11,000 area and the NYSE is still 4.4% below the 2015 high as it continues to lag the S&P 500. The 20-day EMA and initial support is at 10,537 with more important in the 10,300 area.
The weekly NYSE A/D line continues to soar as it has moved even further above its rising WMA. in 2014 a similar period of strength in the weekly A/D line lasted nine months so it is possible the strength could last until the end of the year. To weaken the intermediate term trend the weekly A/D line would have to drop below its WMA. The daily A/D lines are also still strong and show no signs of a top.
Many might be surprised to learn that after the market's strong rally many stocks are just starting to join the party. In my weekend scan of the Nasdaq 100 and IBD top 50 stocks for the Viper Hot stocks Report there were over 30 stocks that gave new weekly buy signals. This means there are still plenty of opportunities.
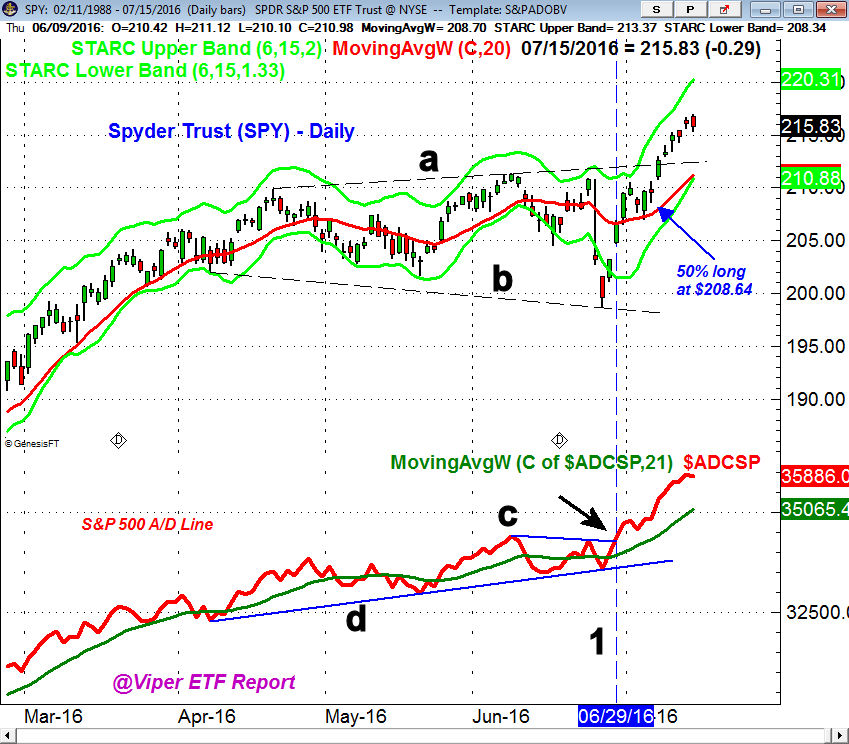
My analysis of the SpyderTrust (SPY) continues to favor a short term pullback in the next week which should be an opportunity to add to positions. This would not be surprising as many of those who were short ahead of the breakout have been forced to cover. A retest of the breakout level, line a, could take the SPY back to the $212-$213 area with the 20 day EMA at $211.19.
The S&P 500 A/D line made further new highs last week but was flat on Friday. The move in the A/D line on June 28th (line 1) was bullish and favored new long positions ahead of the monthly jobs report. It would now take a decisive break in the S&P 500 A/D line below the support at line d, to weaken the technical outlook.
The relative performance analysis continues to favor the SPDR Dow Industrials (DIA) and the iShares Russell 2000 (IWM) over the SPY. Over the past week or so the PowerShares QQQ Trust (QQ) has become much stronger which makes it a potential new buy candidate on a pullback.
What to do? As expected last week we did get a new closing high in the S&P 500 last week. Better than expected earnings over the next two weeks will help justify buying and holding stocks and I do think this is likely.
There are no signs yet that stock investors are getting euphoric and I hope that the high level of bearish commentary continues. I will also be watching the bond market closely as if yields do finally bottom there should be some significant flows from bonds to stocks. Investors should continue to favor positions in low cost, broad based ETFs or mutual funds.
For investors and traders you might consider the Viper ETF Report were I give specific buy and sell advice on both market tracking and sector ETFs
If you are a stock traders I typically make 1-3 new recommendations each week in the Viper Hot Stocks Report. Each service is updated twice a week and is only $34.99 each per month. The subscription can be cancelled on line at any time.
Comments
comments