

In this series of trading lessons I want to concentrate on the bear markets of the past 50 years to see how an investor or trader can use economic data along with technical analysis to gain advance warning of an impending bear market.
There is a very close correlation between bear markets and recessions as stocks generally top out before the economy officially enters a recession.
Therefore a key part of my market analysis is to follow a number of economic indicators in order to gauge the health of the economy.
My favorite is the Conference Board’s Leading Economic Indicator (LEI). It is a composite of ten fundamental indicators and is reported monthly.
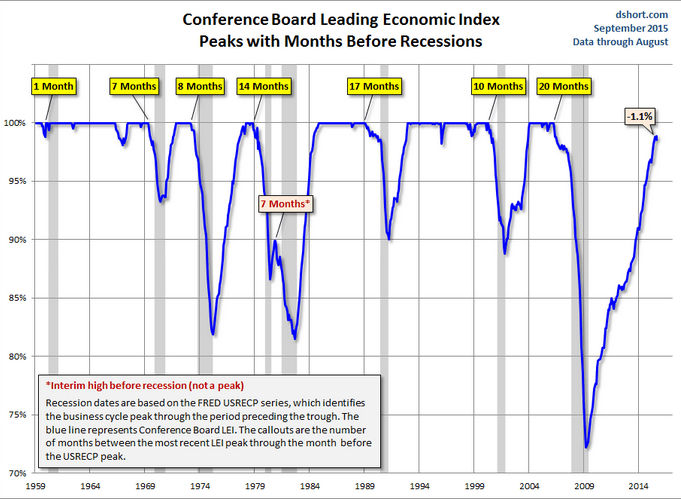
As the excellent chart from dshort.com demonstrates it has a good record of peaking out well before economy enters a recession. I have added annotations to the chart for this discussion. For example the recession in 1969-1970 started in December 1969 but the LEI peaked 7 months ahead of the recession, point 1, in May 1969.
The bear market in 1973-1974 was the most severe since the crash of 1929 as the recession started in November 1973. The LEI peaked 8 months earlier in March 1973, point 2. On the chart I have identified six different bear markets and in 1979-1982 there were officially two different recessionary periods.
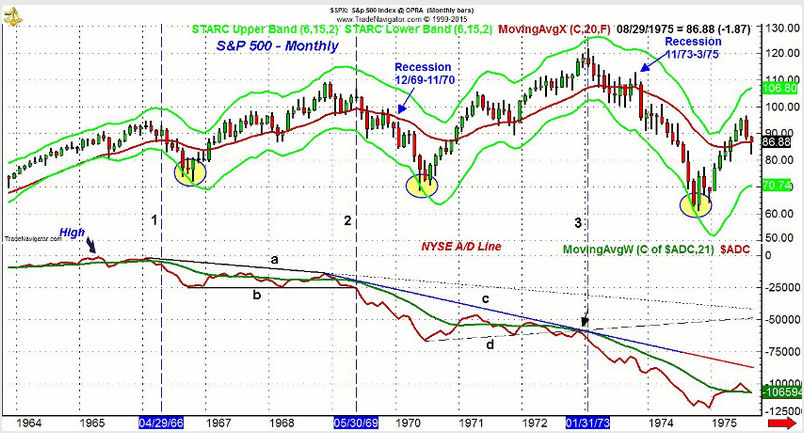
Between the late 1960’s and 1975 there were actually two bear markets. Therefore I am using a monthly chart of the S&P 500 and NYSE A/D line to cover the entire period. The monthly and weekly NYSE A/D line peaked in April 1965 and then formed lower highs in early 1966. By April 1966, line 1, the A/D line had started a new downtrend as it had dropped below its declining WMA and the prior low.
The S&P 500 finally bottomed out six months later and from high to low the S&P had declined 23.6%. Now this crossed the 20% threshold for a bear market but the decline only lasted ten months and the economy was not in a recession. In the three months when the S&P 500 was bottoming out the monthly starc- band were tested.
On the rally from the October 1966 low to the December 1968 high the monthly NSYE A/D line was very weak as it never started a new uptrend. At the 1968 high the A/D line was below the peak from 1967 so further divergences were formed. In February 1969, the A/D line dropped below its WMA and in May 1969 the major support at line b, was violated (line 2). Seven months later in December 1969 the economy officially entered a recession. The LEI (see point 1, Fig1) peaked In May so it supported the negative signals from the monthly A/D line.
By the time the recession was officially over in November 1970 the S&P had already rallied 27% from its low. As the S&P 500 continued higher in 1971 and in 1972, the monthly A/D line formed lower highs. The A/D support at line d, was broken in July 1972 and as the S&P was making new highs the A/D line was only able to rally back to its declining WMA (see arrow). When the S&P 500 made its high on January 31, 1973 (line 3), the A/D line was already declining.
The recession officially began ten months later in November 1973 but the LEI had peaked in March. This was eighth months before the start of the recession and two months after the A/D line had dropped below support. This bear market lasted 622 days as the S&P 500 declined over 48% finally bottoming in October 1974.
I hope that this review of these two past bear markets has shown you how the LEI can be a valuable tool to use along with the A/D line to identify bear markets in advance. I encourage you to start following the LEI. It is reported each month by the Conference Board as they always issue a press release.
I would suggest you set up at least a weekly schedule to monitor the weekly and daily NYSE A/D lines. Watch not only for long term but also short term divergences between the A/D line and prices.
If weekly divergences are spotted in the A/D then wait for the A/D line to drop below support. This will signal that a correction is underway. If the LEI has been declining for several months when this occurs then a bear market may be starting.
Comments
comments