

It has been a good week for the stock market as the NYSE A/D line made a new high Tuesday after the speech by Fed Chair Janet Yellen spurred some fresh new buying. The A/D numbers have been strong so far this week and positive numbers by Friday's close is what is needed to trigger a rally in the S&P 500 top the 2100 area.
Many are still skeptical of the rally from the February lows (Is There Blood In The Streets Yet?) and it looks as though it will take a close above the $207 level in the Spyder Trust (SPY) to convince more of the remaining bears.
According to AAII the individual investor became less bullish last week as it dropped to 27.2%. This is down 6.6% from 33.8% the previous week. This is a positive sign for the markets as it suggests that investors are still nervous. It is somewhat contrary to the new correction low in the VIX as it is in a well defined downtrend consistent with a low level of fear.
The Technology Sector Select (XLK) has moved to new all time highs confirming that the correction is over as it is up 9% in the past month and now up 4.3% YTD. The XLK is now 3.4% above its 20 day EMA so a correction is still likely in the next few weeks.
As the month draws to a close, two of the highest profile technology stocks, Apple, Inc. (AAPL) and Amazon.com (AMZN), are looking quite interesting based on the monthly and weekly charts. They can help one devise a strategy for these stocks in the months ahead.
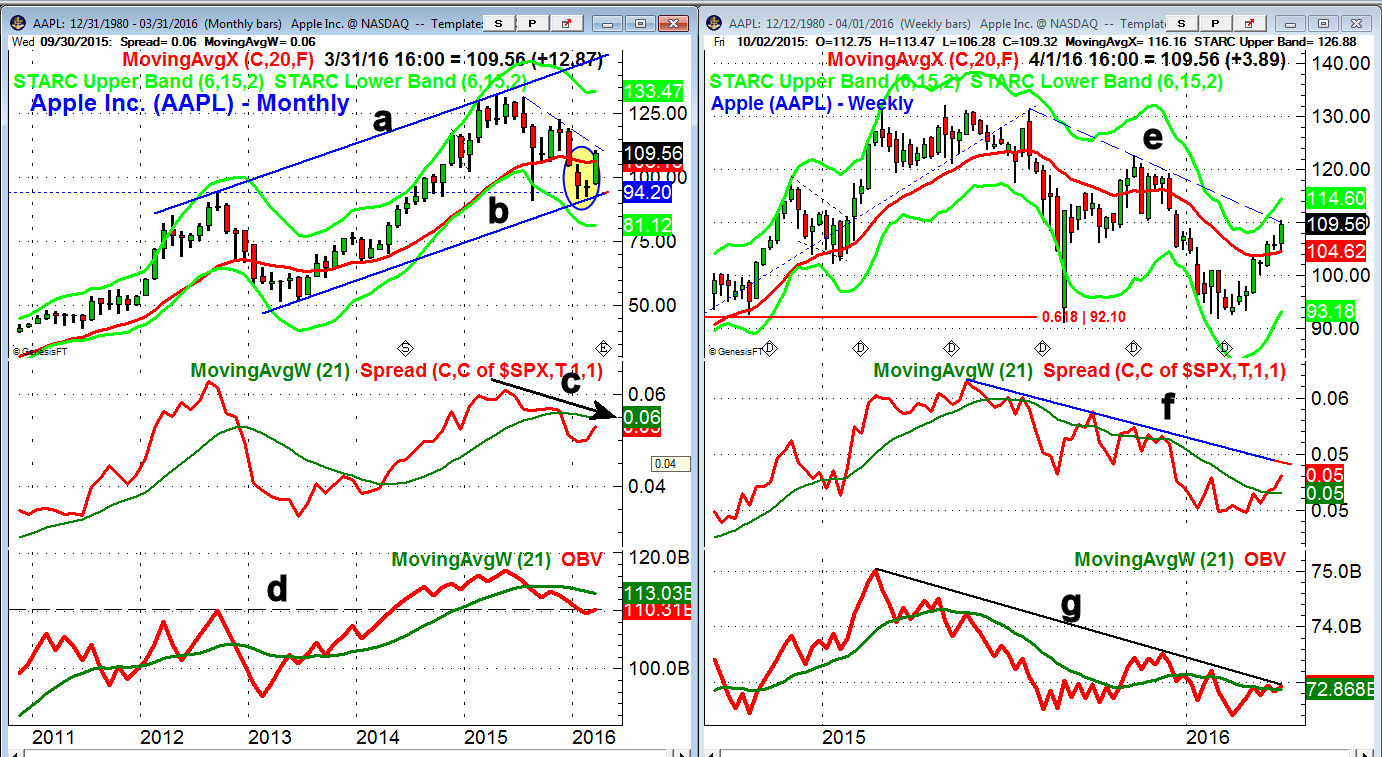
The strong monthly close in Apple, Inc. (AAPL) will be well above the February doji high of $98.89. So far in 2016 AAPL is up 2.8% which is a better than the 1.1% YTD gain in the SPY.
- Based on the data through 3/30 the 2nd quarter pivot is at $103.96 so AAPL looks ready to start the new quarter above its QPivot.
- The monthly resistance from 2015 is in the $119.21 to $122.63 which corresponds to the November and December highs.
- The monthly starc+ band is at $133.47 which is just above the all time high at $132.09.
- The monthly relative performance has turned up but it still below its WMA which was violated at the end of the year.
- The monthly OBV is trying to turn up from the long term support at line d.
- The 20 month EMA is at $106.18 which represents longer term support.
The weekly chart of Apple, Inc. (AAPL) shows that the downtrend from the 2015 highs, line e, has been reached.
- The weekly starc+ band is at $114.58 with the 61.8% retracement resistance from the 2015 high at $116.23.
- The last major weekly swing high is at $122.63.
- The 20 week EMA is at $104.60 with more important support in the $100 area.
- The weekly relative performance has moved above its WMA and the previous high, consistent with a new market leader.
- The weekly OBV is just barely above its WAM and needs to overcome the downtrend, line g, to turn positive.
- The daily studies are positive with the 20 day EMA at $104.80.
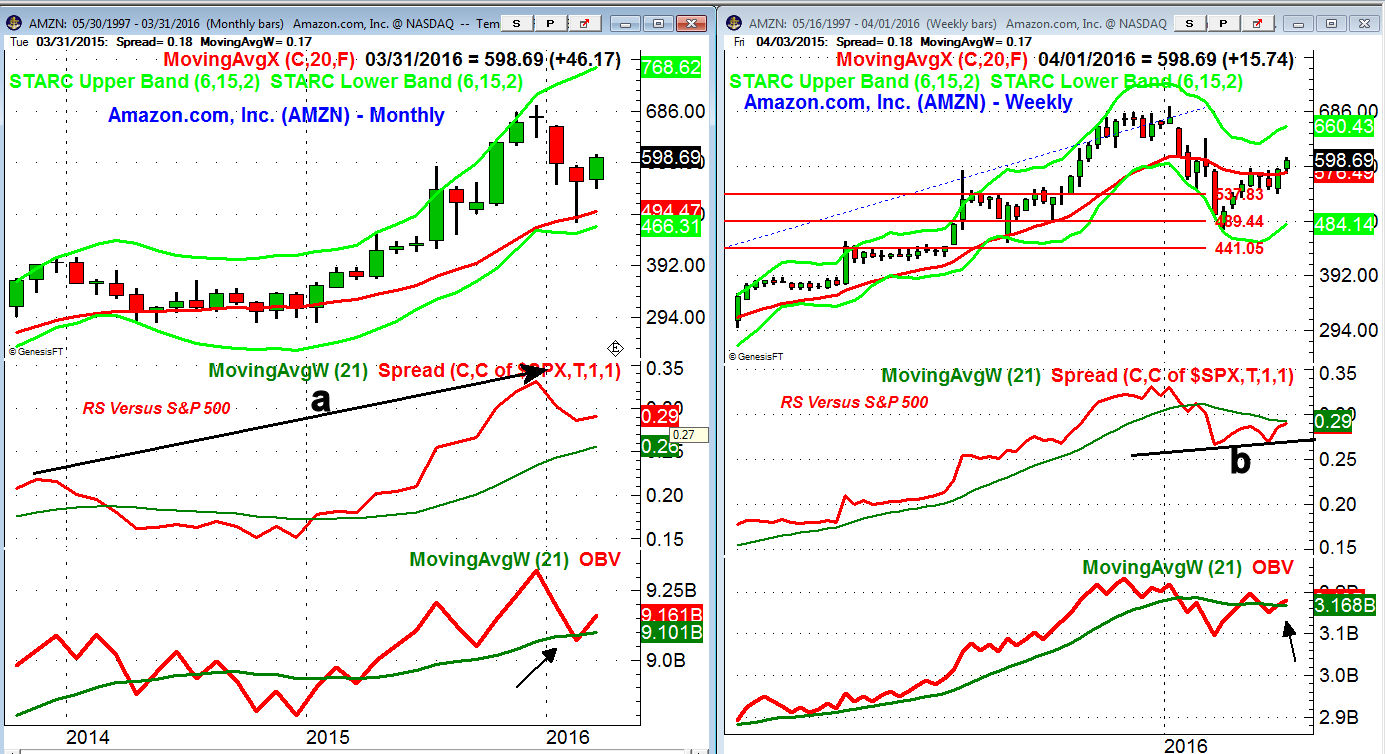
Amazon.com Inc. (AMZN) dropped down to test the 20 month EMA at $474 in February before rebounding sharply. It is still down 11.4% YTD as it formed a doji in December with a close at $675.89.
- The next monthly resistance is in the $620 area with monthly support now at $538.58 which was the March low.
- The monthly relative performance made a convincing new high with prices in December and still looks strong.
- Based on the data through 3/30 the 2nd quarter pivot (QP) is at $570.53 so AMZN also looks ready to start the new quarter above its QP.
- The weekly on-balance-volume (OBV) also made a new high with prices and will flip back above its WMA this week. This is a bullish sign.
- The monthly starc+ band was tested at the November highs and has risen now to $768.60.
The weekly chart of AMZN shows that it looks ready to close above the four week resistance at $585.
- The next weekly resistance is at $638.06 with the weekly starc+ band at $660.38.
- The 20 week EMA and initial support is at $576.47.
- The more important support now stands at $538.58 and the four week lows.
- The weekly relative performance is very close now to moving back above its WA which would be a good sign.
- The weekly OBV is back above its WMA and a move above the previous peak would be a sign of strength.
- The daily studies are positive but not yet in the breakout mode.
- There is short term support at $573.69 and the 20 day EMA.
What to do? Both of these high tech giants do look positive based on the monthly charts and technical studies. That does not mean that they have to accelerate to the upside right now but it does suggests they should be significantly higher by the summer. Therefore I will be looking for a good entry point on a pullback and both are followed in my Viper Hot Stocks Report.
Comments
comments