

The stock market’s decline last Wednesday was the largest in eight months as many panicked investors ran for the exits. Even though the stock market was able to rebound by the end of the week many investors will be pondering their portfolio allocation over the weekend.
Without getting into my own political judgment on the future of President Trump and what may or may not have happened past history indicates that this problem is not going away soon. I have been following politics since before Watergate and have extensively studied the 1973-1974 bear market.
The bottom line is that we are likely to be discussing the political firestorm for many more months as only a sudden resignation could clean the slate quickly. So what is an investor to do?
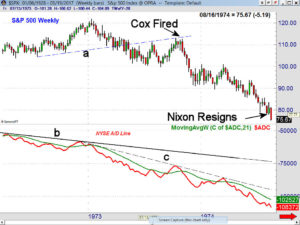

I have always advocated basing ones investing strategy on hard data which avoids acting based on a fear of what might happen. In October 1973 when Archibald Cox was fired by President Nixon the S&P 500 had already been declining from the early January of 1973 as it broke support, line a, in April.
The S&P 500 bottomed in August 1973 and started a rebound that lasted into October as the former support, now resistance (line a) was tested. The rebound high was 112.82 which was below the key 61.8% Fibonacci retracement resistance level at 113.27.
Just six weeks after Archibald Cox was fired the S&P had already dropped below the August lows. It is important to notice that as the S&P 500 was making its high the NYSE A/D line had formed lower highs as indicated by line b. The A/D line had actually peaked in early 1972 and the ten month bearish divergence was consistent with a bear market.
The rebound in October 1973 just tested the near term downtrend in the A/D (line c) which was typical of a bear market rally such as what occurred in the spring of 2008. The NYSE A/D line made a series of lower highs and lower lows until August of 1974 when Nixon resigned. The bear market ended in early 1975.
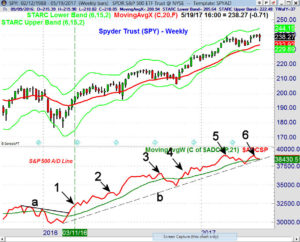

The stock market and the Spyder Trust (SPY) were in a corrective mode from June 2015 until February 2016 based on the A/D line analysis. The A/D lines started to diverge after peaking in May 2015 and the market finally capitulated in August. The chart shows a downtrend, line a, that warned of the sharp drop in early 2016.
This resistance was overcome in mid-February after the daily A/D lines formed bullish divergence and the bullish sentiment of individual investors reached an extremely low level. By March 11th the S&P 500 A/D line had moved above the late 2016 high, point 1. It continued to make new highs over the next few months and the new high in May (point 2) indicated the market drop in reaction to the Brexit vote would be short lived.
The A/D line rallied sharply the next month and made significant new highs before peaking in late September, point 3, just before the pre-election correction. The lack of any divergence indicated a correction would be well supported. The A/D line dropped below its WMA for seven weeks before it moved back above its WMA just after the election. By the end of November (point 4) the A/D line had made another all-time high.
The S&P 500 A/D line started to surge again in late January of 2017 as the continuation pattern I was discussing at the time had been clearly resolved. A convincing new high was made in late February, point 5, as it was over 5% above the November high. The S&P 500 also made a marginal new high on May 5th, point 6 and it shows a clearly positive trend.
After last week’s action to S&P 500 A/D line has turned up from its still rising WMA. More importantly the monthly A/D lines have confirmed the new price highs. At the October 2007 high the monthly A/D lines did form a negative divergence consistent with a bull market top.
The major averages like the S&P 500 and NYSE Composite as well as the tech heavy Nasdaq 100 are in clear uptrends and are well above their rising 20 week EMAs. However as I point out in the Market Wrap section the daily A/D lines on several of the market averages are still in the corrective mode.
In addition to the hard data on the number of stocks advancing and declining which makes up the advance/decline lines I also focus on the actual price data. To avoid most of the noise daily data should not be a focus for investors as the weekly and monthly day are more important.
One very simple trend method I also use is the relationship of the weekly close to the market’s quarterly pivot which is based on the prior quarter’s high, low and close. The pivot is the key level of support or resistance and the longer the time period the more important it becomes.
One thing I have observed about quarterly pivots is that you come up with levels that are different from those derived from other methods. They also can give you a bias for three months of trading. When a market starts off a quarter by closing above its quarterly pivot it has an upward bias, or if it closes the first week of the quarter below it there is a downward bias for the market you are analyzing.
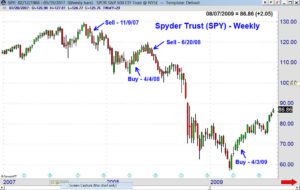

In 2007 the initial weekly sell based on the quarterly pivots occurred on 11/9/07 which was four weeks after the market made its high. This sell signal was reinforced by the negative monthly and weekly signals from the NYSE A/D line. This was reversed by a brief buy signal on 4/4/08 as SPY had a Friday close above its quarterly pivot. On 6/20/08 a new sell signal was generated.
This sell signal lasted until the start of the 2nd quarter of 2009 as a quarterly buy was generated on 4/3/09 as SPY closed the week above its quarterly pivot. The quarterly analysis did turn negative prior to the 2010 and 2011 corrections but overall the analysis has been positive for most of the bull market.
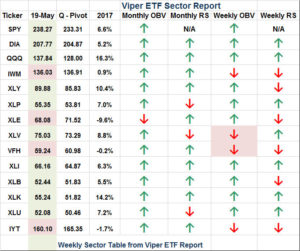

The most recent quarterly signal occurred on November 11, 2016 as the SPY closed above the 4th quarter pivot at $211.52. The table is part of the Viper ETF Report for Monday May 22nd. As a regular feature it provides a wide range of data including this quarters pivot for SPY at $233.31.
The table also shows the quarterly pivots for some of the other market tracking and sector ETFs. Those highlighted in pink IWM, XLE, VFH and IYT closed on Friday below their quarterly pivots. The XLE has been below its quarterly pivot since early February. Each week or month I also examine whether the relative performance and on-balance-volume are above or below their WMAs. After last week’s action the weekly OBV has dropped below its WMAs for both XLV and VFH.
I believe that a systematic data driven method of gauging the market’s trend like that presented in the table can help investors avoid reacting emotionally to large swings in the stock market. In determining profit taking levels I try to exit positions on strength and do not always wait for sell signals.
For example on Wednesday May 10th the First Trust Dow Jones Internet ETF (FDN) hit the sell level for investors at $94.44 which closed out longs from $80.86 for a 16.5% profit. FDN had been moving sideways at just above the quarterly pivot resistance at $94.21. It had a high last Tuesday at $95.15.
Traders also sold longs in the Technology Sector Select ETF (XLK) at $55.44 for a 19.8% profit as XLK had reached monthly pivot resistance. The intermediate term outlook for both FDN and XLK is positive so I will be looking for a good point to establish new long positions in these ETFs.
Based on the hard data I see no reason at this point to alter your portfolio strategy but if you do have outsized profits in some positions, like those in FDN or XLK taking profits on strength is always a good idea.
I would encourage all to look at the relative performance (RS) analysis of their holdings as it is available on several free platforms. The PowerShares QQQ Trust (QQQ) has had positive weekly RS analysis all year and is up 16.6% YTD. In contrast RS on the iShares Russell 2000 (IWM) has been below its WMA since mid-February and it is up just 1.20% YTD.
The Economy
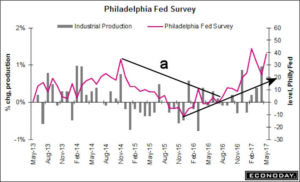

It was a good week for the economy as even though the Empire State Manufacturing Survey at -1.0 was weaker than expected the Philadelphia Fed Survey at 38.8 was well above the consensus estimate at 19.6. This survey bottomed out last summer as it broke its downtrend, line a, and shows a strong uptrend. As Econoday commented “points once again to acceleration for the factory sector”.
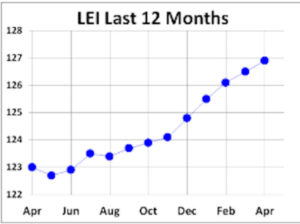

Home builders remain optimistic as the Housing Market Index rose to 70. The latest report on Housing Starts was weaker than expected with more data on housing this week. The Leading Indicators (LEI) came in as expected at 0.3% and still is in a sold uptrend. It is one of my favorite economic indicator and the analysis of Doug Short shows that it has a good record of topping out ahead of a recession.
This week we have a number of speeches by the Fed Governors as well as the Chicago Fed National Activity Index Monday is followed Tuesday by New Home Sales and the Richmond Fed Manufacturing Index. On Wednesday we have the Existing Home Sales, the flash reading on the PMI Composite and the release of the FOMC minutes.
On Friday we get the preliminary reading on 2nd quarter GDP, Durable Goods and Consumer Sentiment.
Interest Rates & Commodities
Yields dropped last week as many flocked to the 10 –Year T-Notes as stocks plunged last week. The yield closed at 2.245% which is just above the recent low at 2.177%. In order to turn the trend towards higher yields the 10 Year T-note yield needs to close above 2.423%.
The rally in crude oil has been impressive as the July contract bottomed three days after my article “Watch For A Bottom In Crude Oil & XOP”. Last week crude oil closed up $2.50 per barrel. The weekly OBV and HPI turned positive early last week but the weekly indicators though rising are still negative.
Market Wrap
All of the major averages were lower last week except the Dow Utilities which managed a 0.43% gain. For the second week in a row the Dow Transports and Russell 2000 were the weakest losing 1.35% and 1.12% respectively. The S&P 500 had a low of 2352.72 but then closed at 2381.75 down 0.38%. On the NYSE there were more stocks declining than advancing.
The technical outlook from the weekly advance/decline lines is still positive as the weekly A/D lines for the NYSE, Nasdaq 100, Dow Industrials and S&P 500 are still above their rising WMAs. The Russell 2000 A/D line is still slightly below its WMA. The daily A/D lines are still corrective on all the major averages except the Nasdaq 100.
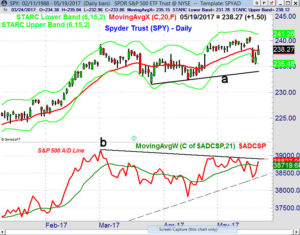

The Spyder Trust (SPY) hit a low of $235.43 on Wednesday and hit a rebound high of $239.08 on Friday but closed well below the highs at $238.27. This was just above the 20 day EMA. Friday’s action barely filled the gap from Wednesday lower open which is characteristic of an oversold bounce.
There is initial support at $236.71 with the daily starc- band at $235.48. The monthly pivot support is at $233.89 which is very close to the daily chart support at line a. The quarterly pivot is at $233.31.
The daily S&P 500 A/D line is above its WMA but needs a convincing close above the resistance at line b to signal a move to new highs. The daily starc+ band is at $241.27 with monthly pivot resistance at $243.73.
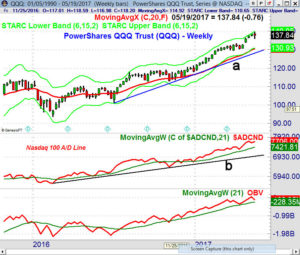

The PowerShares QQQ Trust (QQQ) was down 0.5% last week but still closed near the weekly starc+ band at $140.05 as the yearly pivot resistance at $138.99 was exceeded last week with the high at $139.64. On Wednesday the QQQ closed below the 20 day EMA (now at $136.81) and the daily starc- bands.
If the QQQ drops below the week’s low at $135.87 there is further support at $133.48. The weekly starc- band and 20 week EMA are now in the $130.50-$131 area. The weekly Nasdaq 100 A/D line is close to its all-time high and is well above the rising WMA. It shows no signs yet of a top.
What to do? The rebound at the end of the week makes this week’s close more important as a higher close will increase the odds of another push to the upside. The rebound was enough to reduce the bearishness of Wednesday’s drop but I am not yet convinced. If the weekly A/D numbers are positive the NYSE, S&P 500 and Nasdaq 100 A/D lines are likely to make new highs.
A slightly lower close will suggest that the market is going to consolidate further and potentially could drop below last week’s lows. On the other hand a sharply lower close will suggest a drop to longer term support before the market’s correction is over.
Given the current environment it is especially important to be selective in purchasing new ETFs. Viper ETF subscribers are still long a number of ETFs but will be selective in adding new positions until the daily A/D lines complete their corrective patterns.
If you are interested in specific buy and sell advice in ETFs, you might consider a one-month investment of just $34.95. Subscribers receive two in-depth reports each week and subscriptions can be cancelled on line at any time.
It was a wild week for stocks as there were many earnings reports that sent stocks sharply higher and sharply lower. On Wednesday I recommended selling CSCO and EXP in the Viper Hot Stocks portfolio ahead of their earnings as I felt the risk was too high. The technical readings for Autodesk (ADSK) favored holding onto longs and it closed up 14.7% on Friday.
In addition to my regular Twitter comments I have started posting more detailed technical comments on the Viper Report Facebook page . I will be posting the rationale for our ADSK strategy on Sunday.
Thanks for reading this article. Here is an e-book you might like: Four Ways To Improve Your Entries and Exits
Comments
comments