

This analysis was originally released on February 2, 2020 just a few weeks before the Covid triggered stock market plunge. To see Tom's latest video here is the link
It was the worst week for the stock market since last summer, as the coronavirus was a focal point for the sellers to coalesce around. For the past few weeks, I have been highlighting the market risk and the complacency of investors as the S&P 500 closed higher for thirteen of the past seventeen weeks since the October 2019 low.
My tongue-in-cheek post from January 19, 2020 I pointed out that in the latest survey from the American Association of Individual Investors, the percentage of bullish investors (Bullish %) rose 8.76 points to 41.83%. In the chart, it was also interesting that the NAAIM Exposure Index, put out by the National Association of Active Investment Managers, also appeared to have topped out.
In over eight years of contributing to Forbes.com, I have frequently discussed various sentiment measures, and have always emphasized that one should not act on an extreme bullish or bearish sentiment reading unless the technical indicators also confirm with a positive or negative signal.
This time, the technical indicators are aligned. As it turned out, the Bullish % rose further to 45.6% for the week ending January 24, while the NAAIM Exposure Index declined further. With the stock market close on January 24, a majority of the daily Advance/Decline (A/D) lines had also turned negative.
In this article, I'll be reviewing a few different case studies of extreme investor sentiments from the past few years, and the technical signs that went along with them

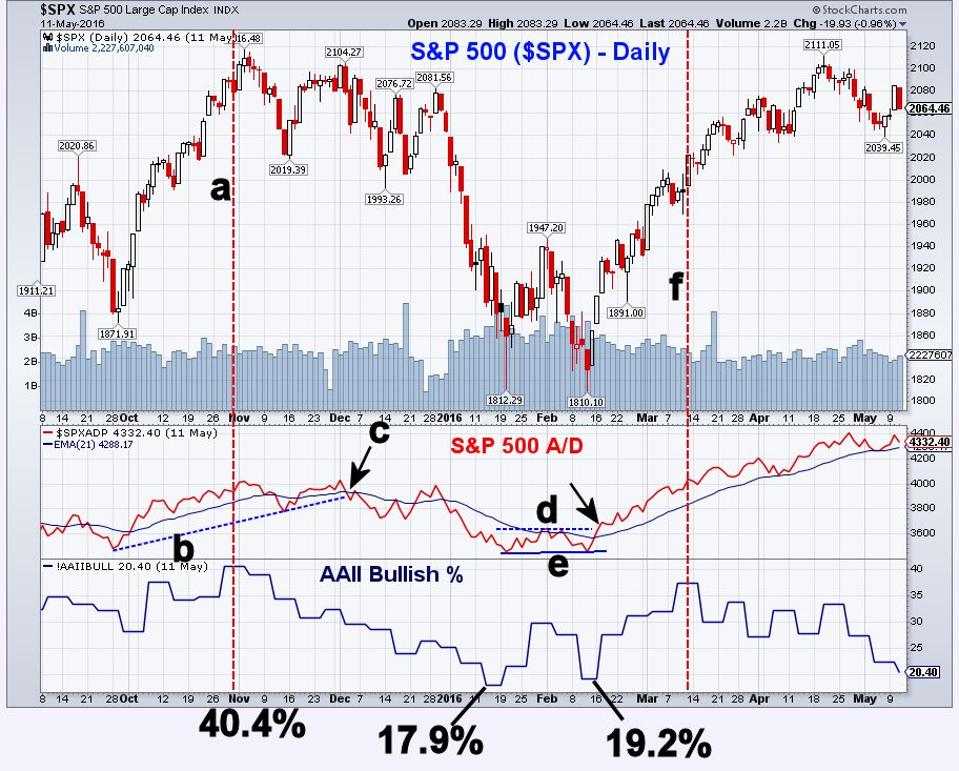
The first daily chart of the S&P 500 goes from September 2015 through early May of 2016. Below the chart in red is the S&P 500 A/D line with a 21-period Exponential Moving Average (EMA). The AAII Bullish % Sentiment is shown below the A/D line. For the most part, I have found the Bullish % readings to be more useful that the bearish % readings in predicting future action.
On October 29, 2015, the Bullish % was 40.4%, which was the highest reading since February 2015. At that time, the daily S&P 500 A/D line was positive, both in a clear uptrend and above its rising EMA. The November low allowed one to draw an uptrend (line b), which was violated on December 3 (point c). This was a sign of technical weakness. The S&P 500 subsequently declined from 2080 to an eventual low of 1812 on January 20. As I Tweeted on January 14, 2016, the bullish % reading of 17.9% was the lowest reading since 2009.
The S&P 500 was very oversold, so my view then was that a “short term rally is likely” . Furthermore, I thought that “even a 1-3 week rebound may be met with another wave of selling and a test of the prior lows before an intermediate term bottom could be completed.” At the January lows the A/D line showed no signs of a bottom.
After an eight-day, 120-point rally in the S&P 500, the sellers again took over on February 2. On the rebound the bullish sentiment improved to 29.75%, but by February 11, it had dropped back to 19.2%. The S&P 500 A/D line did not make a new low, instead testing its most recent low point (line e).
On February 17, three days after the low, the S&P 500 A/D line completed its bottom formation by moving above its nearest resistance (line d). At this point, when the prices were low and the A/D line had bottomed was the time to buy, which I noted at the time. Even though the Bullish % rose in March to 37.4% (line f), the A/D line was in a clear uptrend and well above its rising EMA. There was no reason to react to the rise in the bullish %.
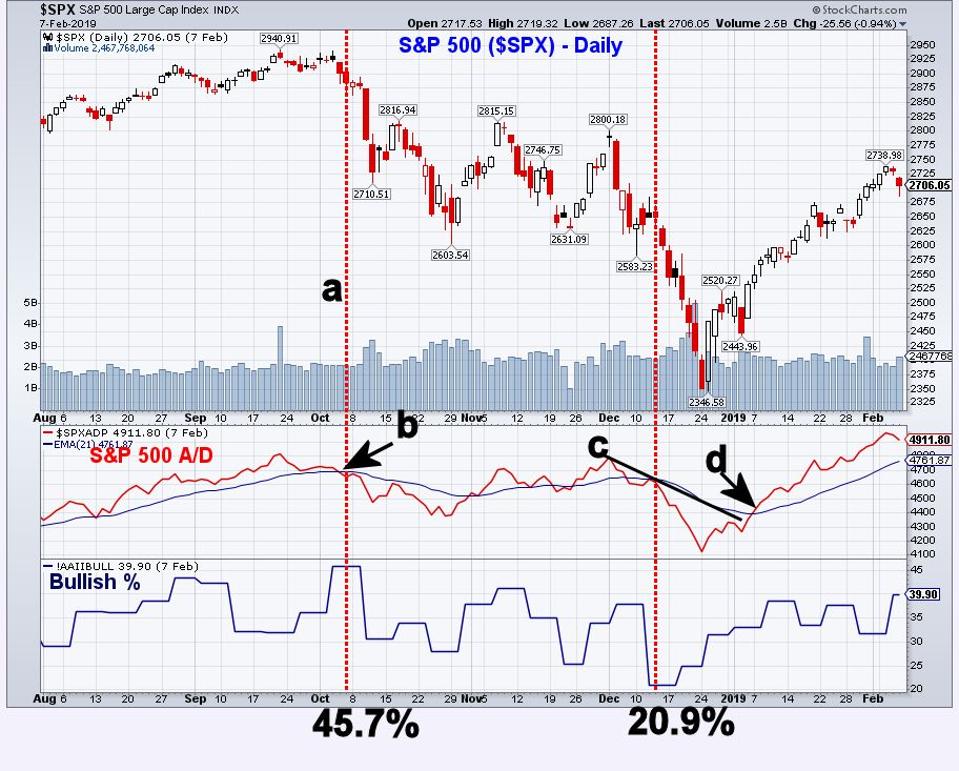
The S&P 500 A/D line made a high on September 21, 2018. The A/D lines for most of the major averages did as well, except the NYSE All A/D line, which formed a negative or bearish divergence as the NYSE Composite was making a new high (see chart).
The S&P 500 A/D line just kept declining, and by October 4 (line a) had dropped below its EMA. This coincided with a jump that week in the Bullish % to 45.7%, which was the highest reading since the start of the year. This was a bearish combination of negative A/D lines and too-high Bullish %.
The bullish % formed a series of lower highs until plunging on December 10 to 20.9%. At that time, the A/D line was well below its declining EMA and therefore negative, so there was not a reason to buy, even though the Bullish % was very low. The downtrend in the A/D (line c) was broken in early January, and a few days later the EMA was also overcome. This was the time to act on the low level of bullish sentiment from December 10.

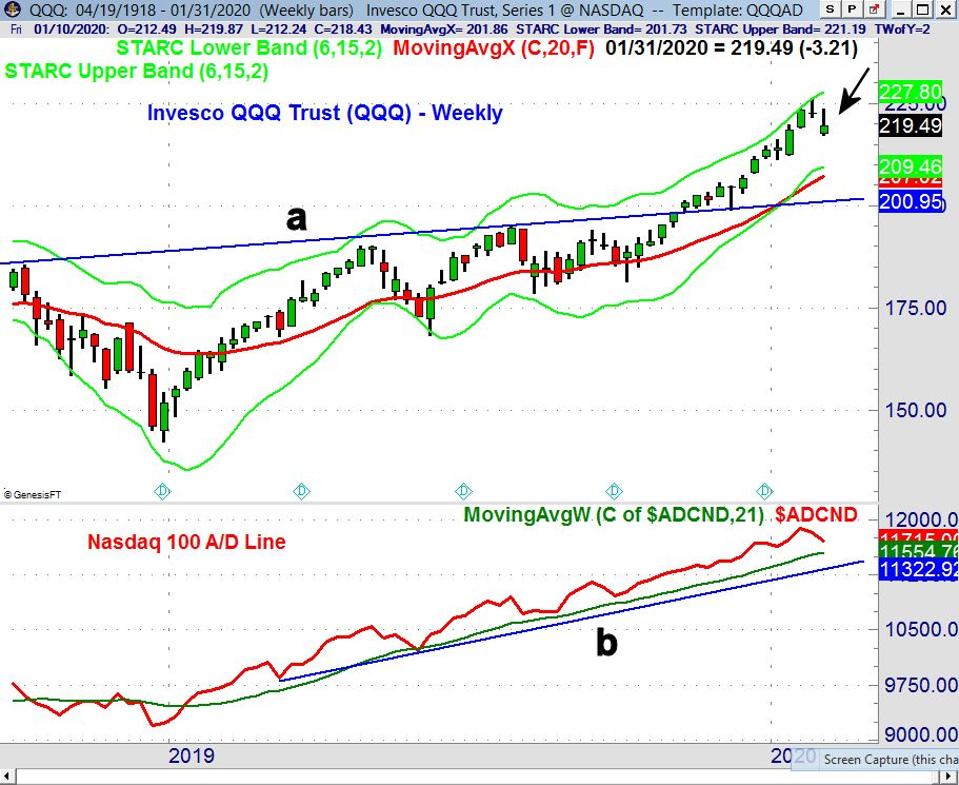
Heading into last week’s trading, there were a number of other signs that the market risk was high. The Invesco QQQ Trust (QQQ) had been reaching or exceeding its weekly starc+ band for four weeks, and then last week formed a doji, which was a sign of indecision. The Friday close at $219.49 was below the doji low, so a weekly sell signal was generated (see arrow). There is the next good weekly chart support at $211-212. The rising 20 week EMA is at $207 with the breakout level at $200.95 (line a).
The weekly Nasdaq 100 A/D line peaked the week of January 17, and has declined for the past two weeks. It is still well above its rising WMA and the long term support (line b). The monthly A/D line (not shown) made a new high in January, so both the intermediate and major trend are positive.
Despite the rough end to the month, the QQQ was still up 3.3%, but it lagged the performance of the SPDR Gold Trust (GLD) which was up 4.5%. I reviewed the technical outlook for GLD and the long term seasonal pattern in gold last week.
The current decline should present a buying opportunity. After this week’s action, which culminates with Friday’s monthly jobs report, I should have a better idea of where the correction may end. I will be waiting for my advance/decline analysis to tell me when it is a good time to get back into the stock market.
In my Viper ETF Report and the Viper Hot Stocks Report, I update subscribers with my A/D Market Trend analysis twice per week, along with specific buy and sell advice. Each report is just $34.95 per month. New subscribers also receive six free trading lessons.
Comments
comments