

Forbes.com: Feb 6, 2024 The stock market survived the earnings reports from five of the seven tech maga stocks as well as the FOMC and latest jobs report. So, what is next? The media market focus has moved on to worrying investors and traders about the historically weak February stock market performance.
Those who are students of the market know that in my view behind every stock market headline there is generally another perspective that needs to be considered. That I feel is the case with the weekend Bloomberg headline “Stock Market’s ‘Rah-Rah Mob’ Confronts February’s Weak Record.”
Over the past 10 years, the best January S&P 500 performances were in 2018 and 2019 with gains of 5.2% and 9.1%, respectively. As I pointed out last year, 2017 was another year where the Wall Street strategists were way too negative with their year-end forecasts. Wall Street reacted by jumping into the market at the start of 2018.
The S&P 500 and Nasdaq 100 moved higher in January despite the AAII survey that reflected a bullish % reading of 59.75%. That was extremely high and set the stage for a sharp market decline that dropped the S&P 500 5.2% in one week and the Dow Industrials had two declines of more than 1,000 points. In February 2018 the S&P closed down 3.6%.
The S&P 500 declined 9.9% in December 2018 as the S&P plunged 2.7% on Christmas Eve, December 24. It had almost dropped 20% and reached bear market territory before it rebounded sharply after Christmas.

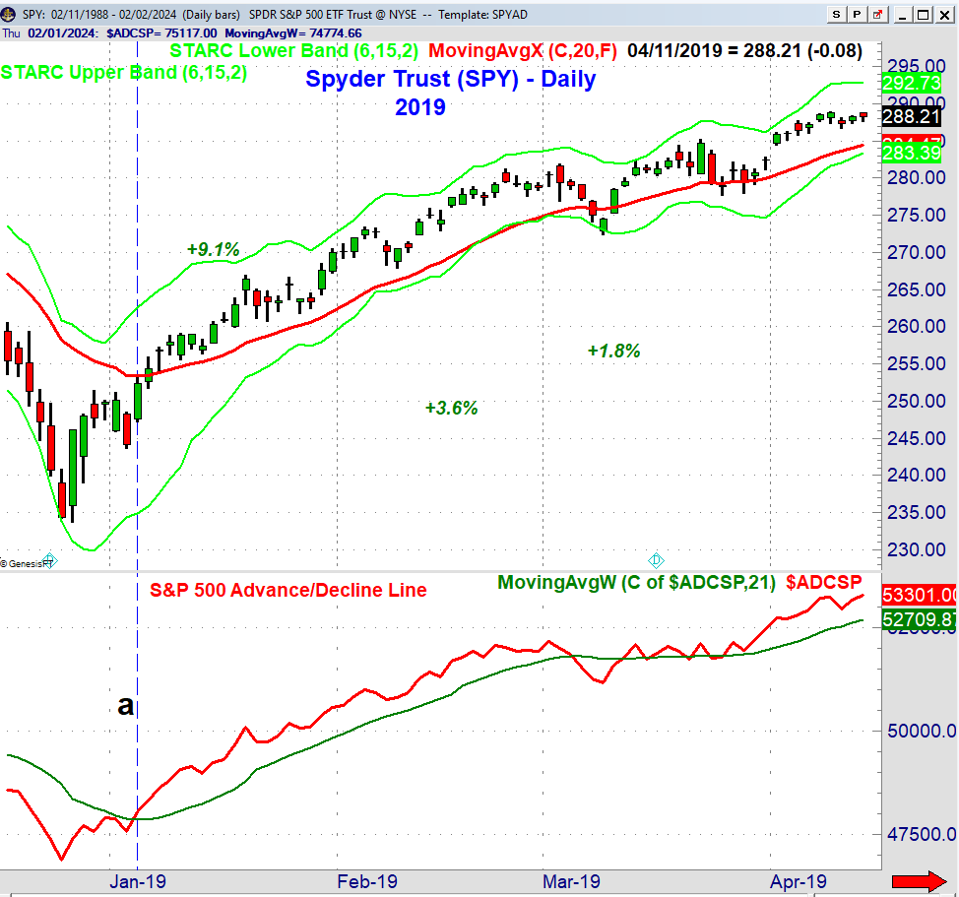
The rally in the S&P 500 continued into early 2018 as the daily S&P 500 Advance/Decline closed above its WMA on January 4th, line a. Two days later it closed above the monthly pivot at $254.85. The following week the S&P 500 A/D also closed above its weekly WMA. It closed the month at $269.93 for a gain of 9.1%. The S&P 500 was up another 3.6% in February and added 1.8% in March.

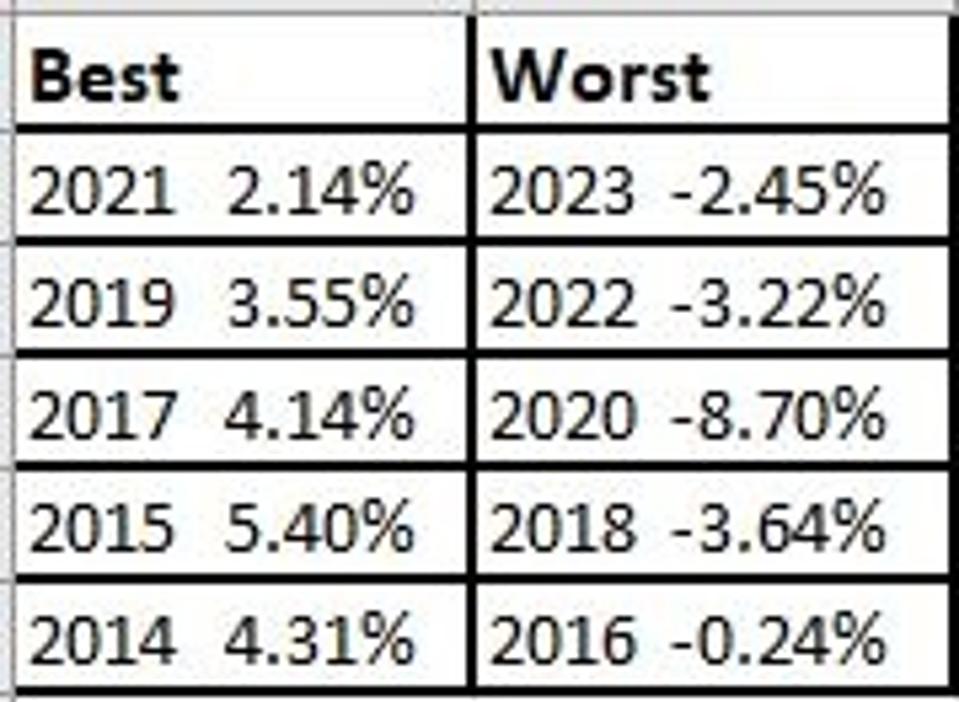
This table has the last ten years of February's performance. The best performance was in 2015 which corresponded to a major stock market bottom. The worst February was in 2020 as the stock market plunged in reaction to the Covid outbreak. The average gain was 3.9% a bit better than the average loss of 3.5%.

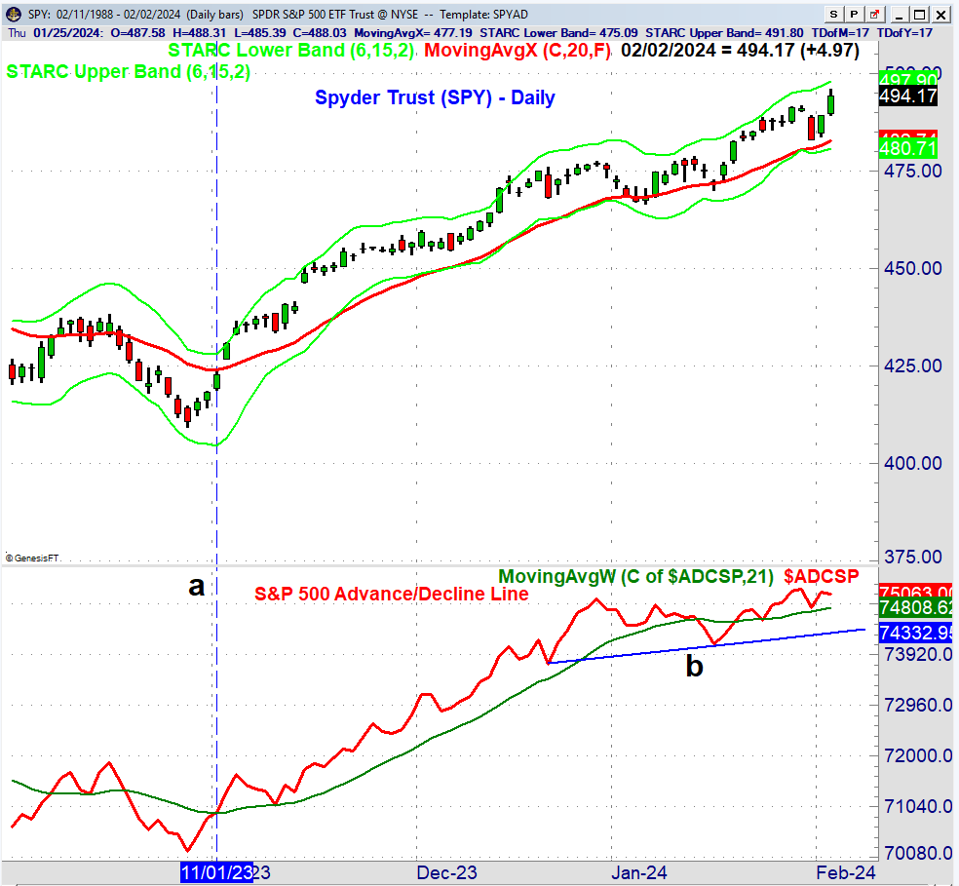
So far, February is starting well as the Spyder Trust (SPYPYSPY) is up 2.37% in the first two days. With SPY at new all-time highs, there are no chart targets but the yearly R1 resistance is at $511.18. There is initial support at $483.72 and the 20-day EMA with the monthly pivot at $480.31.
The S&P 500 Advance/Decline line moved above its WMA and turned positive on Nov. 1, 2023. The A/D line dropped below its WMA for five days in the middle of January but did not form a new downtrend. Therefore as long as the support, line b, continues to hold a positive performance is favored for February.

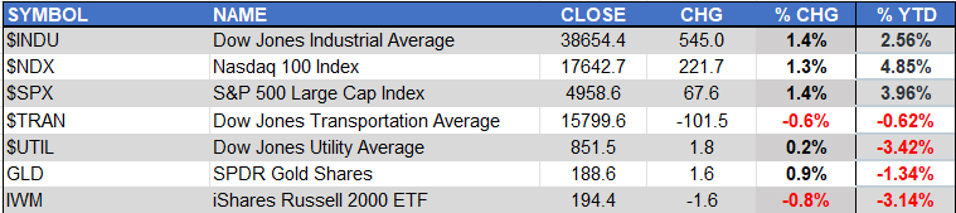
There were solid gains for the week in the Dow Jones Industrial Average and S&P 500 (SPX) as both were up 1.4%. The Nasdaq 100 Index ($NDX) was not far behind up 1.3%. All three are showing solid gains year-to-date (YTD) with the ($NDX) up 4.8% followed by a 3.9% gain in the $SPX.
The iShares Russell 2000 (IWMIWM) was the weakest down 0.8% followed by a 0.6% decline in the Dow Jones Industrial Average. The Dow Jones Utility Average ($UTIL) is down 3.4% YTD followed by a 3.1% decline for IWM. The Spyder Gold Shares are down 1.3% YTD.
As of Friday’s close, only the IWM A/D line is negative but I do monitor these daily for signs that the trend is changing. There are no signs yet from the $VIX of a correction. There are some signs of weakness in the Nasdaq New High and New Low analysis.

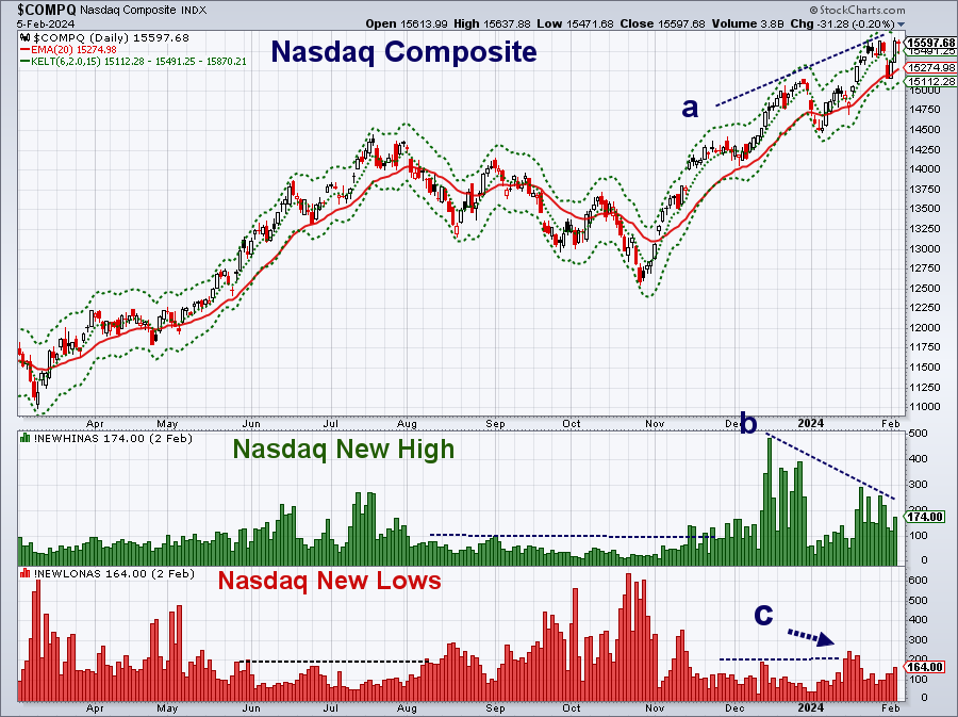
The Nasdaq Composite has made a series of higher highs in December and January, line a. The New Highs peaked on December 14th and then formed much lower highs and a negative divergence in January as noted by line b.
The New Lows moved above the early December high in January as they reached 224. They have again started to edge higher. A strong move above 224 in the daily New Lows would be a stronger warning.
So if we get the average gain in the S&P 500 based on the last five years of 3.9%, the potential target would be 5034. Using the average decline of 3.5% would give a downside target of 4675. Now a five-year average may not be statistically significant it will give you an idea of the potential reward as well as the risk.
Comments
comments