Forbes: August 20, 2023
Early in my transition from biochemist to technical analyst many of us kept manual chart books. When we were traveling overseas we frequently exchanged market data. In those pre-internet days, there was often more communication between analysts and more concentration on the daily price data.
This was in the infancy of computer analysis of the financial markets so technical analysts paid more attention to traditional methods of chart analysis than they do in today’s markets. Still, I have been surprised that since the bear market lows in March 2009 several key turning points, both up and down have often been ignored or missed.

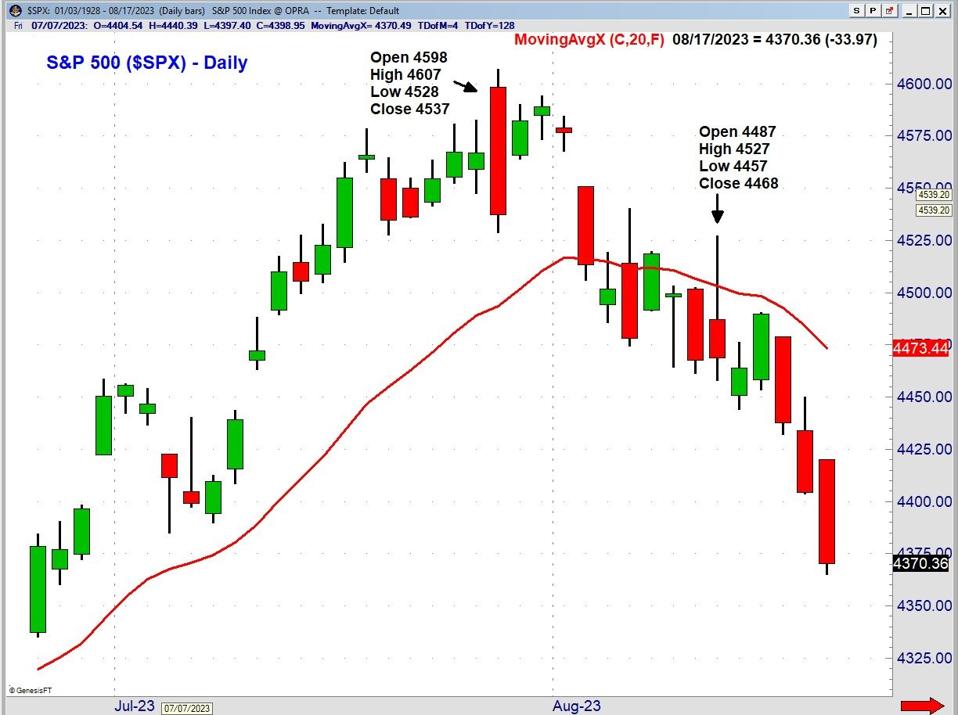
On July 27th the S&P 500 opened 31 points higher at 4598 reached a high of 4607 but then closed at 4537 which was below the low of the previous four days. This was a key reversal formation that was discussed in the next day’s Viper Market Report. The Dow Jones Industrials also ended its thirteen days of consecutive higher closes on the 27th.
In my weekend commentary, I pointed out that this “key reversal” occurred on heavier volume than the past three days and 2nd highest for the month”. At the time the A/D lines were strong and trending higher. “But a drop below the WMAs or EMAs would be the first warning sign that the market could be closer to a meaningful correction”.

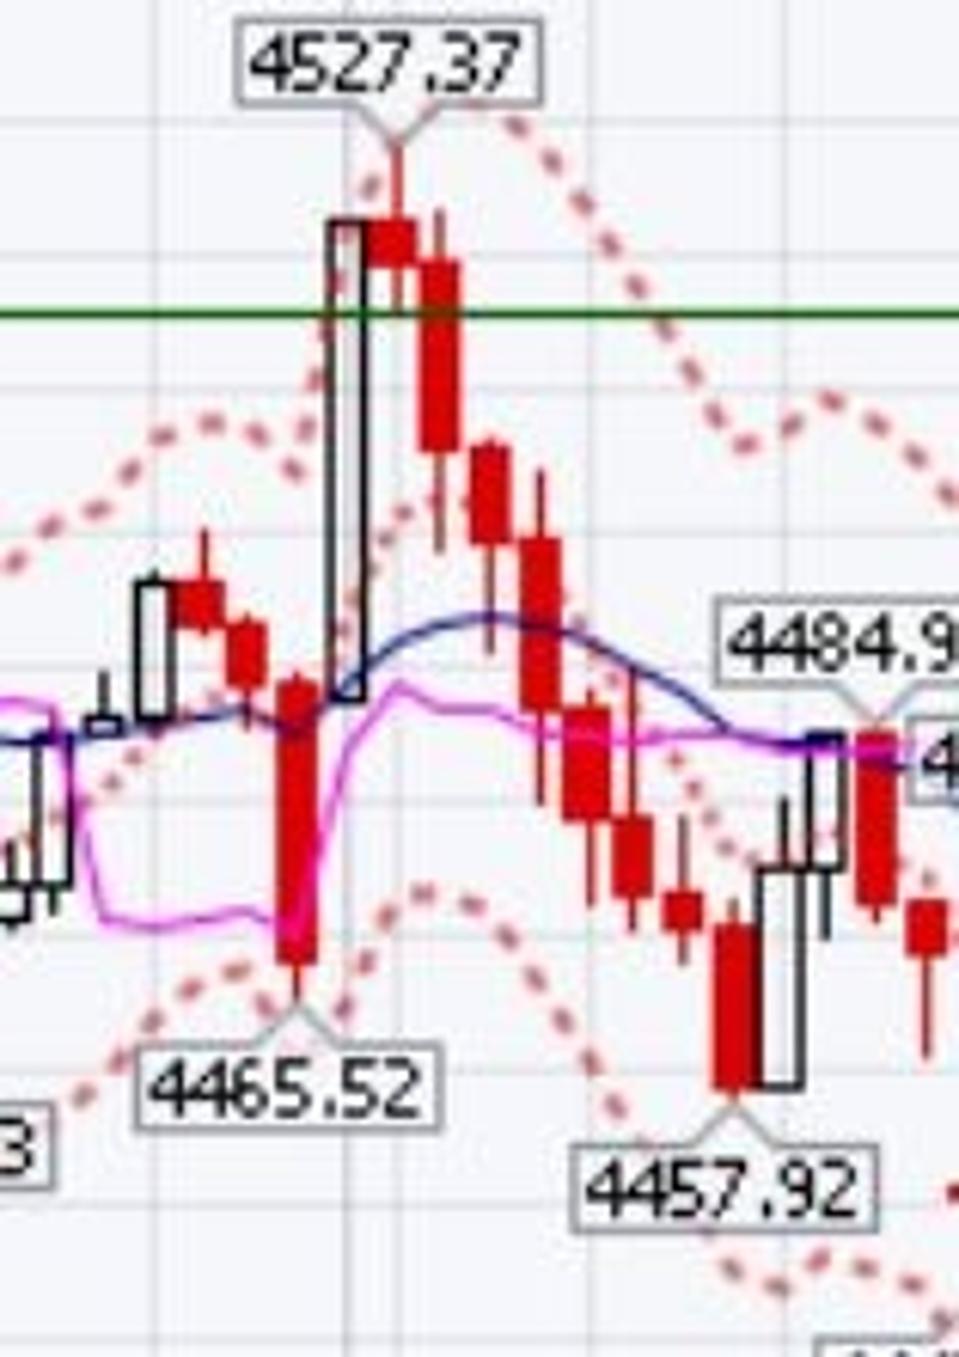
The stock market’s reaction to the July CPI report on Thursday, August 10th also trapped many late buyers at an unfavorable price. The report reflected a bit lower inflation than expected as the futures had moved higher in the pre-market. The S&P 500 opened 12 points higher at 4487, rallied to just over 4527 (see chart) before again reversing to close lower for the day at 4478.
The daily A/D lines were negative heading into the report with the S&P 500 below its declining 20 day EMA. This negative trading criterion meant to me that even a better-than-expected report was not expected to reverse the negative daily trend.
This is a good example of why all traders should look at the daily price action not just the close. This reversal added to the selling pressure from the prior week as selling dominated the market action last week.

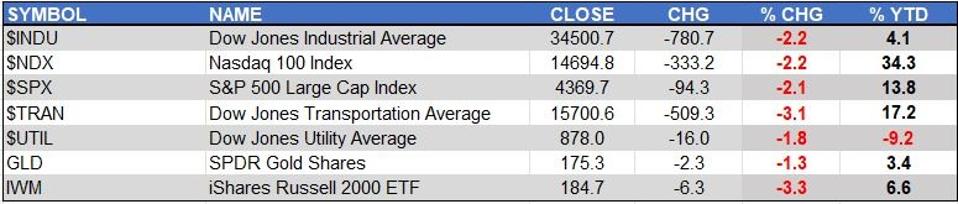
Solid red last week in the market review led by a 3.3% decline in the iShares Russell 2000 while the Dow Jones Transportation Average was down 3.1%. The Dow Jones Industrial Average and Nasdaq 100 dropped 2.2% just a bit weaker than the S&P 500.
The Dow Utilities added to its losing performance this year as it dropped 1.8% and is now down 9.2% year-to-date. The relentless nature of the selling last week is illustrated by the data from the NYSE. Only 540 issues advanced last week on the NYSE while 2538 advanced.

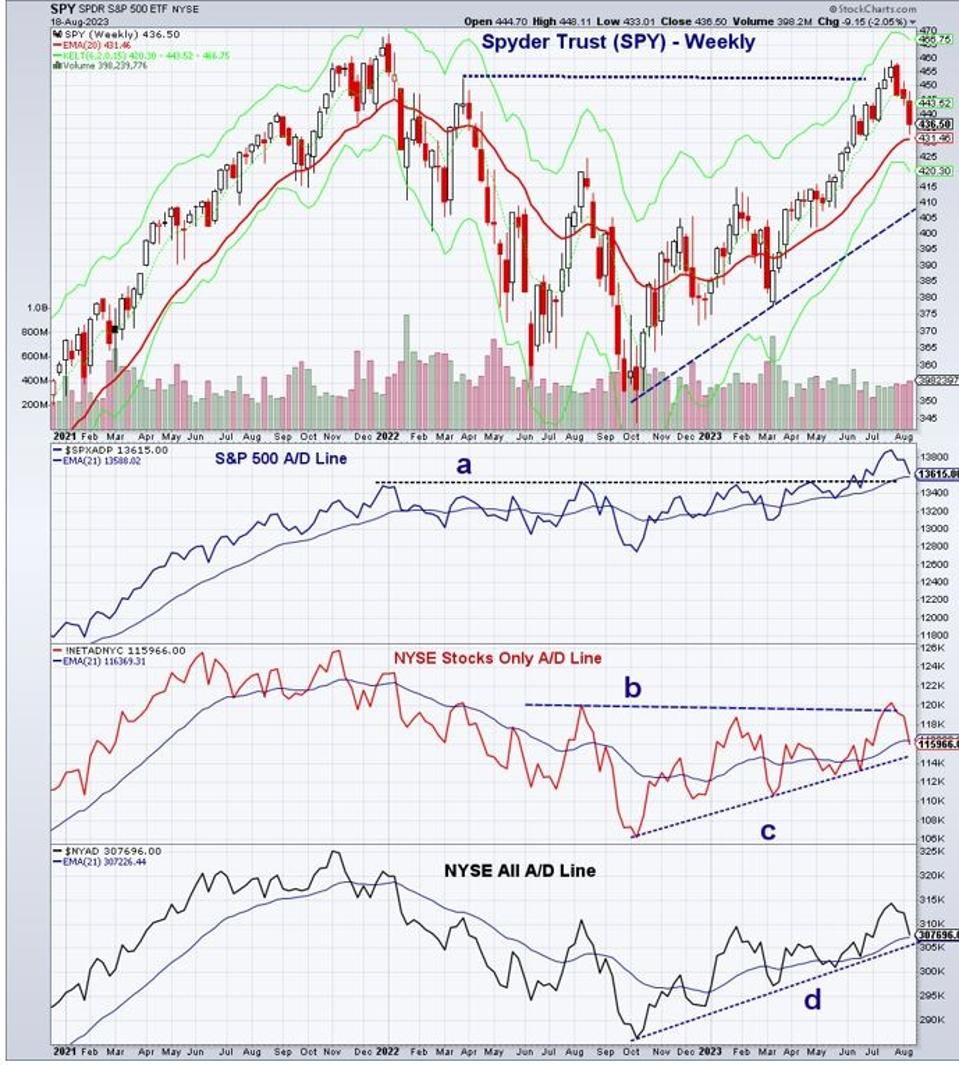
The three-week decline in the Spyder Trust (SPY) SPY) has taken it close to the rising 20-week EMA at $432.23 as it is down 5% from the high. The QPivot is at $430.44 with the August 2022 high at $424.79. The S&P 500 Advance/Decline line dropped sharply last week but is still above its EMA and the breakout level line a.
The NYSE Stocks Only A/D line did close below its EMA but is well above its support at line c and still in an uptrend. The NYSE All A/D line is still holding up better as it is above its EMA and support at line d. A drop below the May-June lows will be a greater sign of further weakness. Many short-term oscillators, like the NYSE A-D, are back to levels last seen at the March lows.
The bearish key reversal on July 27th has set the market’s tone for the past three weeks. I felt it would have a short-term negative impact but the rally failure on the CPI report was a further warning.

There have also been several bullish reversals over the years that have identified key turning points when investors and traders should have been buying. Some of the older books on chart analysis favored buying the open on the day after a bullish key reversal.
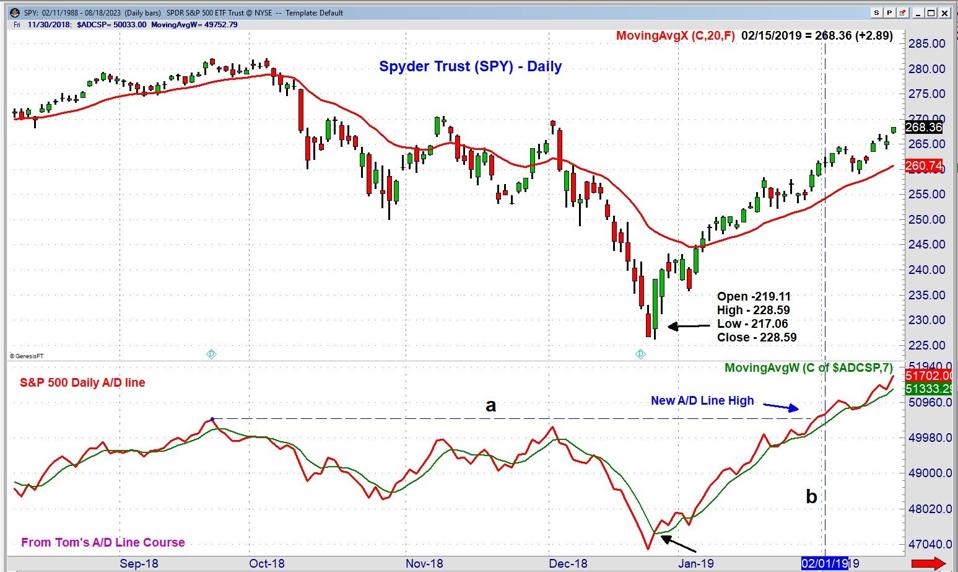
On December 24th the Dow Industrials dropped 653 points or 2.91% while the Nasdaq Composite was 2.2% lower. Because of my A/D line analysis, I was convinced that the last few months of 2018 was not the start of a bear market.
On the December 26th 2018, the S&P had a low of $217.05 which was below the prior day’s low to close on the high at $229.50. The A/D numbers were strong enough to move the S&P 500 A/D line above its WMA which turned it positive. The S&P 500 was down 13.5% in the 4th quarter of 2018 but closed the year 6.9% above the December 26th low of $226.17.
By the end of December 2018, I reviewed the case for a market bottom in Can You Bank On A Stock Market Bottom? as I favored a dollar cost averaging approach in the Vanguard S&P 500 (VOOVOO). It was up 0ver 31% in 2019.
By the start of February, line b, the S&P 500 Advance/Decline line had moved to a new all-time high (line a). Though the S&P was still 7.4% below its all-time high this action indicated that it would eventually also make new highs. The positive signal from the Zweig Breath Thrust (ZBT) on January 10th, 2019 was another bullish sign.

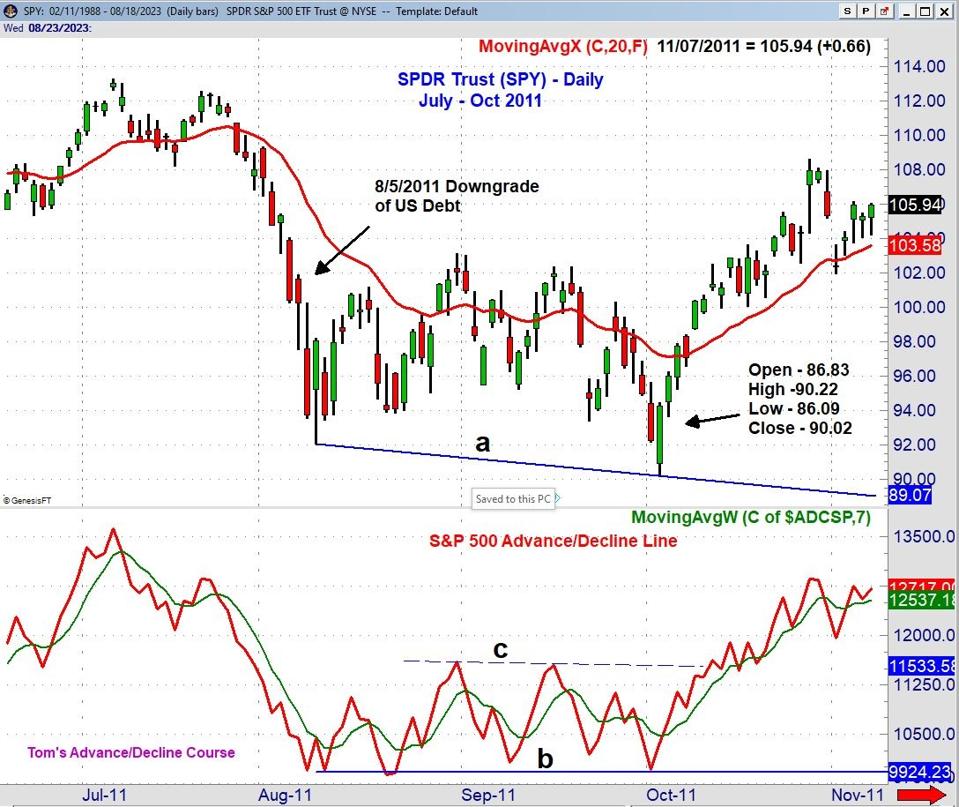
U.S. debt was recently downgraded for the first time since August 5, 2011, and a bullish reversal signaled the end of the market decline that accelerated in reaction to that downgrade.
By the middle of July 2011, the market averages had turned lower and the selling accelerated in early August. The S&P 500 then traded in a sideways fashion for the rest of August and into September as fears of a new recession mounted. On October 4th the S&P 500 dropped to a low of $86.09 which was well below the August 9th low of $92.05.
In a reversal that surprised most the S&P 500 then rallied to close up over 2% for the day and 4.4% above the day’s lows. This was a reversal but not a key reversal as the S&P failed to close above the prior day’s high.
Even though the S&P had made new correction lows, line a, the S&P 500 A/D lines formed higher lows (line b) or a bullish divergence. The divergence was subsequently confirmed by the move through the resistance at line c. This was noted in my contribution to Forbes.com “Be Bold, Be Fearless...Buy the Dip”.
I have often taught traders to look for the formation of dojis after a prolonged rally or decline and will be using this article to reinforce the importance of price reversals. The July 27th reversal was a good reason to reduce exposure on the long side.
There are several reasons, like the higher Put/Call ratios and oversold indicators, that favor a market rebound this week. However, it will take some time before the daily A/D lines can reverse to positive and signal an end to the correction.
If you find some significant reversals that you previously missed, send them my way and I may discuss them in a future article.
Comments
comments