Most investors and traders are aware of the unique information that can be learned by looking at candle charts. The most powerful signal in my opinion occurs after a market forms a doji.
A doji forms when the open and closing price are almost the same. It indicates that the market is indecisive as the bulls and bears are in balance. Signals occur when the market closed above the doji high or below the doji low.
In some instances doji signals are generated on more than one time frame and multiple signals can be quite potent. The action of Apple, Inc. (AAPL) in the fall of 2012 is a good example of why doji signals can be so valuable.
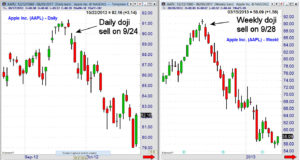

The daily chart of Apple Inc. (AAPL) shows that it formed a doji on Thursday September 20th with a low of $89.88 and a high of $90.71. Doji signals must be viewed in the context of the market’s recent price action. Apple had rallied over 36% from the late July low below $74 to above $91.
Therefore when AAPL closed at $90.72 on Friday September 2st the positive signal should have been treated with suspicion. On Monday September 24th AAPL gapped lower and closed at $89.51 well below the doji low. In just over two weeks AAPL had dropped 10%.
The weekly chart of AAPL shows that it also formed a doji the week ending September 21st with a high of $91.36 and a low of $89.88. The next week (ending 9/28) AAPL closed at $86.44 triggering a weekly doji sell signal. The chart shows that after the doji sell the rallies were very limited as AAPL had dropped below $57 by early 2013.
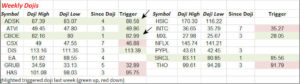
Each week in my Viper Hot Stocks scan I review over 150 high momentum stocks to determine which stocks have generated positive or negative weekly momentum. I also determine which stocks have formed dojis.
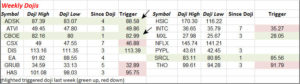

Every Monday I publish the scan results that includes highlighting those stocks that have generated new weekly doji signals. This partial table is from the April 24th report as Autodesk Inc. (ADSK) was highlighted in green as it closed on April 21st at $88.58 which was above the prior week’s doji high of $86.65.
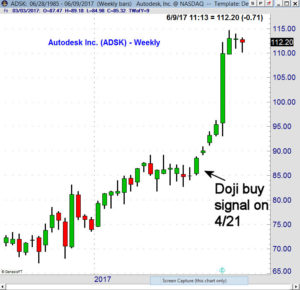

The next week ADSK made a new high for the year and then started to accelerate to the upside surging over 15% after its earnings report. Longs established at $89.56 were sold on Monday May 22nd at $109.80 for a 23.5% profit.

CBOE Holdings (CBOE) had formed dojis the weeks of April 7th and April 14th. The next Friday April 21st CBOE closed at $82.75 which was well above both doji highs. It was also recommended in the Viper Hot Stocks Report and longs were established the next week at an average price of $80.65. Traders are still long as CBOE has not yet hit my first price target.
I published this week’s stock table Monday on the Viper Report Facebook page
Doji signals work on any market and if you are interested in specific advice on ETFs I hope you will also consider the Viper ETF Report. An in depth trading lesson on doji buy signals will be sent out to all new subscribers.
Comments
comments