

The earnings season took over the market this week as there have been a number of big winners and losers. General Electric (GE) was looking very weak technically two weeks ago and it was down another 2.5% in early Friday trading.
Shoe maker Sketchers U.S.A. (SKX) on the other had exceeded expectations on earnings and was up over 37% just after the open. Two of the largest tech companies Amazon.com (AMZN) and Alphabet Inc.(GOOGL) report earnings after the close on Thursday August 26th.
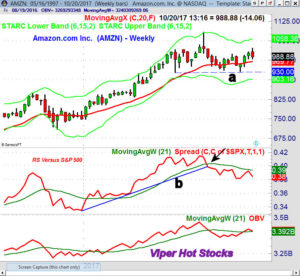

The quarterly pivot for AMZN is at $992.14 and a close below this level looks likely on Friday. This will warn of a change in trend. There is more important chart support now at $930, line a. The weekly starc- band is at $903.07.
The weekly relative performance (RS) measures the performance of a stock or ETF versus the S&P 500 and it one of my favorite technical tools. When it is rising and above its WMA it signals that the stock or ETF is outperforming the S&P 500. Conversely a declining RS is a sign of weakness
The weekly RS dropped below its WMA and the support at line b, in early August. It has turned lower this week as it failed to move back above its WMA. Such a failure is often a bearish sign. The weekly OBV has turned down this week but is still above its WMA. It will turn negative with a lower close next week.
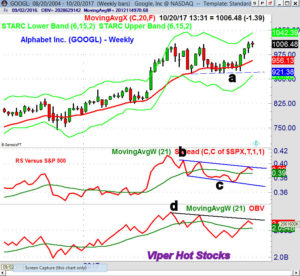
The rising 20 day EMA is at $988 which is initial support while there is more important support at $965 which is the quarterly pivot. There is more important chart support at $921.38 (line a) and the quarterly pivot support is at $923.95. There is initial resistance now at $1022.
The weekly RS has turned lower after reaching the downtrend, line b. It is still above its WMA and therefore positive. The on-balance-volume peaked in June and has since formed lower highs, line d. It turned down this week and the pattern of lower highs suggests that the volume has been declining which reflects decreasing buying pressure.
What to do? For Amazon.com (AMZN) the daily technical studies on are currently neutral so any rally back to the $996-$1009 should be watched closely before their earnings. Should the daily studies generate strong sell signals next week then there would be warnings from both time frames.
On Alphabet, Inc. (GOOGL) the daily studies are positive and a move above the $1015 levels could signal a move to the $1030 area. However given the weekly technical readings a rally ahead of the earnings should be treated with caution given the warnings from the weekly technical indicators. opportunity to hedge or sell part of your position in GOOGL. Either stock is vulnerable to a 10% or more decline in reaction to their earnings reports and both are included in the PowerShares QQQ Trust (QQQ).
Please check back on Forbes Saturday afternoon for my technical review of the stock market.
If you like this type of analysis please consider the Viper ETF Report or Viper Hot Stocks Report. I provide market analysis twice each week and specific buy and sell advice. Only $34.95 each per month.
Comments
comments