

Investors were quite optimistic heading into last week, as there was plenty of economic data that was expected to be strong. Tuesday’s Consumer Confidence supported the positive tone, coming in at 121.7, well above the median estimate of 113. There were no surprises from the Federal Open Market Committee meeting, or from Fed Chair Powell’s news conference. But even after the GDP on Thursday came in at 6.4%, by the close on Friday many investors were disappointed with market.

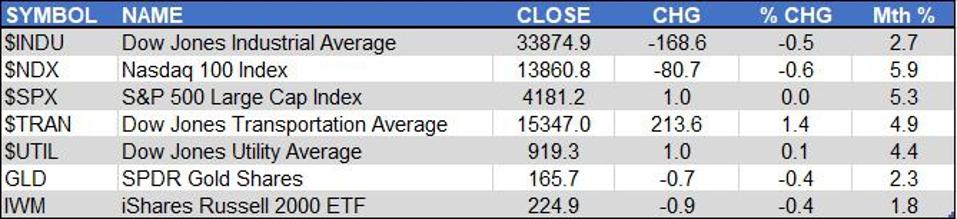
Only the Dow Jones Transportation Average was substantially up, with 1.4% gains led by the airline stocks. This was much better than the 0.1% gain for the Dow Jones Utility Average.
The Nasdaq 100NDAQ was the weakest, down 0.6%, while the Dow Jones Industrial Average lost 0.5%. The S&P 500 was essentially flat for the week, while the SPDR Gold Trust was a bit lower. For the week, there were 1761 issues advancing and 1672 issues declining on the NYSE.

Three weeks ago, I wondered whether investors had unduly optimistic expectations for this earnings season. This was due, in part, to the market's reaction to earnings reports in January. In particular, the response to Apple, IncAAPL. (AAPL)'s earnings was enlightening. While analysts on CNBC and other stations talked up the impressive earnings, the stock action failed to deliver.
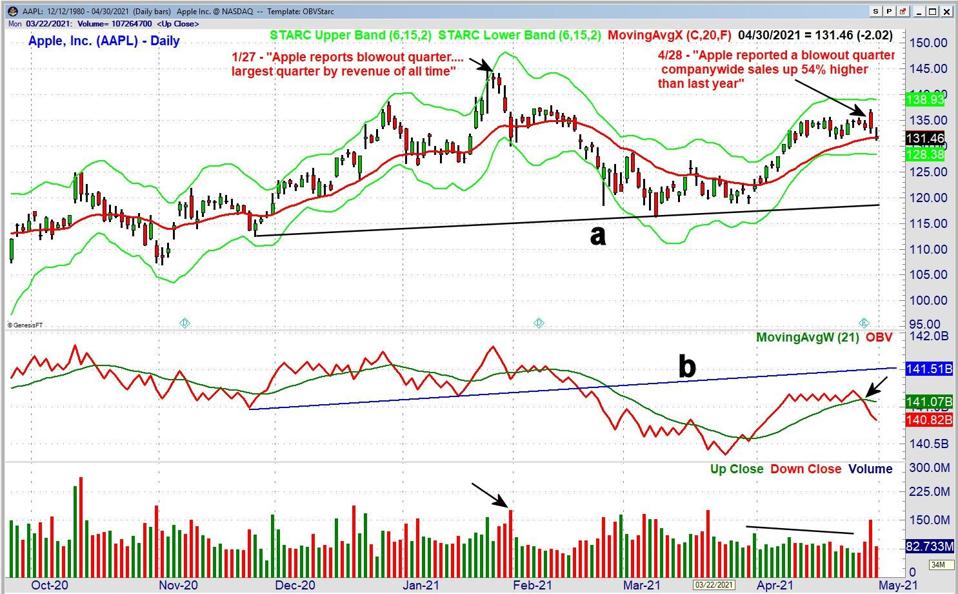
Just ahead of earnings on January 27, AAPL had a high on 1/25 of $144.87, trading above the daily starc+ band, which indicated it was in a high-risk buy area. It traded a bit above this level in after-hours trading, but then turned lower to drop 2%. By January 29, AAPL had a low of $130.02, and the volume increased as AAPL tested the starc- band.
Those who bought on the earnings were disappointed further, as AAPL had a low on March 8 of $116.21, which was a decline of 19.8% from the high. AAPL's On Balance Volume (OBV) dropped below the key support (line b) on February 17, which confirmed the downtrend.
Though the OBV was able to move back above its weighted moving average (WMA) at the end of March, the volume was not strong on April’s price rally. The OBV did not come close to the former OBV support, now resistance (line b).
In the last week’s earnings reports, Apple once again beat all earnings estimates, reporting “sales up 54% higher than last year”. The daily OBV closed below its WMA on Wednesday, April 28, warning that the level of selling had increased. On Thursday, AAPL had a high of $137.07 but then closed at $133.48. It finished the week at $131.46, down 2.13%. The close was just above the new monthly pivot for May at $130.34.

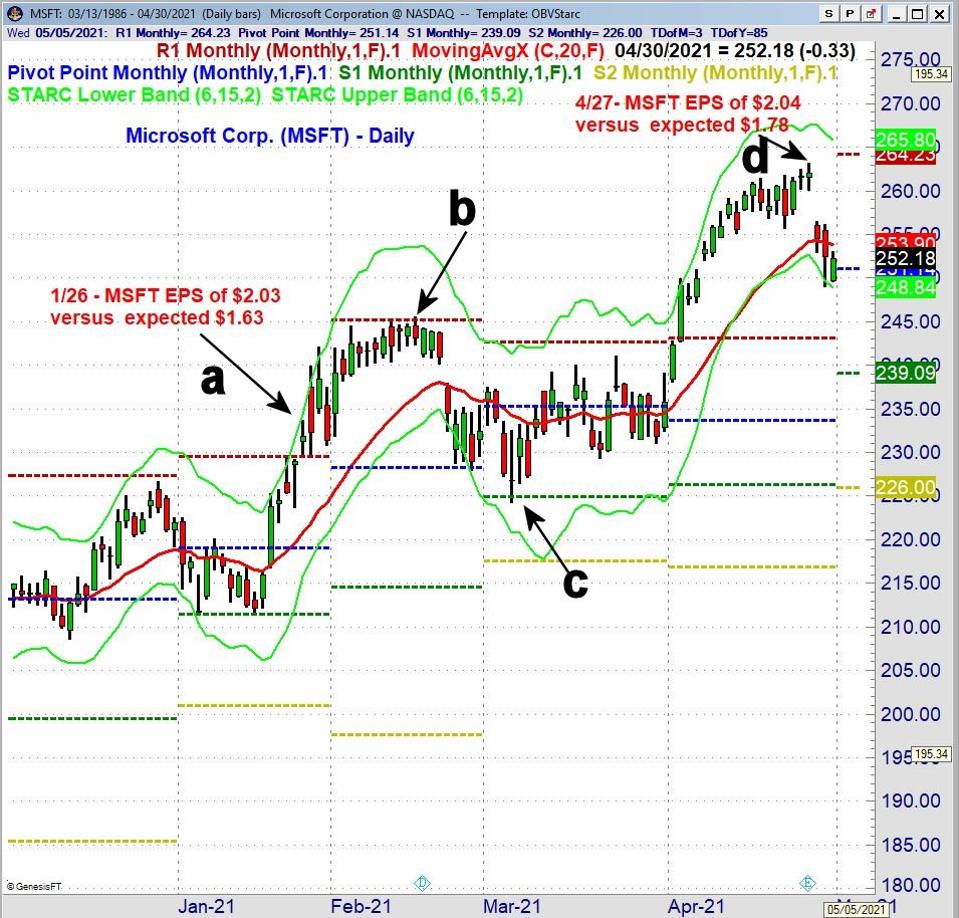
Microsoft CorMSFTp. (MSFT) has had a different reaction to its earnings reports in 2021. After beating estimates on January 26 (point a) on an earnings-per-share (EPS) of $2.03 versus the expected $1.63, MSFT gapped higher and pushed above the daily starc+ bands for two days. After a high of $242.08, MSFT dropped to a low of $230.82, a decline of 4.6% from the post-earnings high.
MSFT rebounded quickly in February to a high on February 16 of $245.56 (point b) which was just above the monthly pivot resistance at $245.19. That was a gain of just 1.4% from the post-earnings opening price. Three days later, MSFT gapped lower and on March 4 (point c) reached a low of $224.26 dropping slightly below the monthly S1 support at $224.82.
MSFT charged higher in April, reaching a high on Tuesday (point d) of $263.19 before it reported earnings. In addition to reporting an EPS of $1.95 versus the expected $1.78, they also had a 33% rise in commercial cloud revenue. But in after-hours trading, MSFT dipped 2.6%. By Thursday, MSFT had a low of $249, which was a decline of 5.4% from the pre-earnings close.

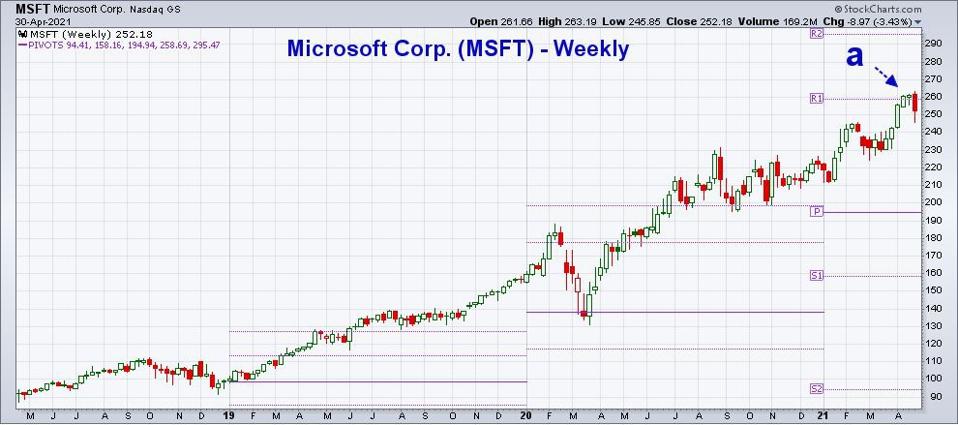
In my analysis, I try to use a number of different analytical methods to come up with important support and resistance levels. Last week, I reviewed the yearly pivot analysis for four market tracking ETFs.
While conducting this analysis, I noticed that the yearly R1 level for MSFT (based on 2020's price action) was calculated to be $258.89. Prices were at these levels for the past few weeks (point a). This is a strong reason to regularly monitor pivot levels, and to be careful about buying a stock before or right after a very strong earnings report. Technical methods can help you further assess the risk.
Did last week’s action in the two tech giants change the overall market outlook? The stock market performance in April was positive, despite the end of the month decline in some of the tech stocks. Still, the performance was split, as noted in the table, as the Nasdaq 100 was up 5.9%, while the iShares Russell 2000 (IWM)IWM was up only 1.8%.

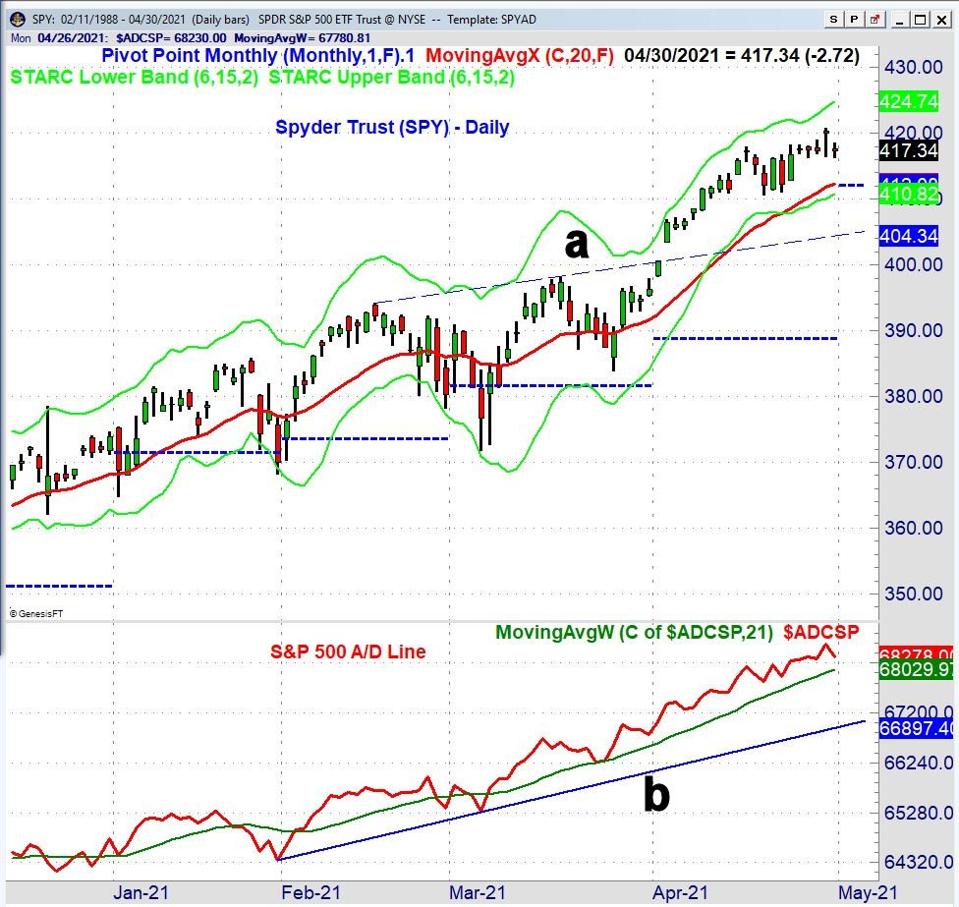
The Spyder Trust (SPY)SPY made a new high Thursday at $420.72. The day-to-day action, as well as the 20-day exponential moving average (EMA), still show a positive trend. The monthly pivot for May is at $412.08, while the breakout level (line a) is at $404.34. The S&P 500 A/D line made a new high on Thursday, and is well above its rising WMA—as are the majority of the A/D lines I follow. Longer-term A/D line support exists at the uptrend from February and March (line b).
For new investments in the current market, one needs to be selective, as some ETFs or stocks look positive technically, while others do not. In my view, using technical analysis rather than fundamental analysis will help keep you in the best stocks or ETFs. In addition, applying risk analysis will increase your likelihood of being profitable. As I have been mentioning for several weeks, the stock market, despite its positive trend, still has a high level of risk. A market correction of 5-10% is needed to lower the overall market risk.
In the Viper ETF Report and Viper Hot Stocks Report, I update subscribers with my market analysis at least twice each week and provide specific buy and sell advice. I follow both growth and value ETFs. Each report is just $34.95 per month. New subscribers also receive six free trading lessons, a $49 value.
To learn more about the stock market and investing take advantage of this limited time special offer to spend 90 minutes with Tom.
Comments
comments