
As the major averages made further new highs this week the economic data continued to confirm that the economy is strong. The Friday’s job report was weaker than expected due to the hurricanes and stocks were a bit lower on Friday.
It still was a good week for the major averages with the S&P 500, Dow Industrials, Russell 2000 and Nasdaq 100 all up over 1%. This week has likely reinforced the bullishness of Wall Street strategists. At the end of September 87% of those responding to a CNBC survey expected stocks to “finish the fourth quarter higher with seventy-nine percent expecting a jump of at least five percent”.
This was in sharp contrast to how they felt at the end of June as they were “urging investors not to chase the rally in the U.S. stock market …as their average year end prediction was for 2439”. This is about 100 points below Friday’s close.
Their bullish forecast would put the S&P 500 above 2600 but I was even more surprised that most thought that stocks were correctly valued. The bullish headlines and the stock market’s performance so far in October may encourage some to jump into stocks now, but is that really a good idea?
As the advance/decline lines were turning positive at the start of September (see Tweet) there were many analysts and high profile fund managers that were warning about the stock market. Given the political turmoil around the world and the disarray in Washington DC their nervousness was not that surprising.
For those who are either not invested or under invested there are two common mistakes. One is to buy the best performers like the small cap iShares Russell 2000 (IWM) which was the focus of last week’s article “How Much Higher Can The Small Caps Go?”


The daily chart shows the rally from the low at $133.82 as it broke through resistance, line a, at $146 just two weeks ago and it is now 2.7% higher. But if one were to buy now at $150 how much risk would be acceptable? A risk of 5% would mean you would exit the position if IWM dropped below $142.50.
The current 50% support level is at $142.20 so the stop still might be too tight. The last major inflection point is at $138.26 (line b) but a stop under this level on a purchase at $150 would mean a risk of 7.8%. In my experience this is too high a risk in a market that is already sharply higher.
Though I mentioned a potential upside target last week of $160 for IWM but that would only be a 6.6% increase from $150. Therefore buying at $150 and risking to $142.50 would mean you are risking 5% to possibly make 6.6%.
Though this may be acceptable to some traders or investors in my opinion taking this high a risk has the potential to damage the long term health of your portfolio. Five consecutive losing trades of 8% each could drop your portfolio by 40%.
Even though there are no signs yet of a short term top the preferred strategy that I use in the Viper ETF Report is to do additional buying on a pullback where the risk is closer to 3-4% and the potential reward is greater.
In a market that continues to make new highs investors or traders may consider buying those stocks that have lagged the market in the hope that they will finally catch up with the market. The two worst performing stocks in the Dow Industrials this year are General Electric (GE) down 33.3% YTD and International Business Machines (IBM) which is down 11.6%.
This is in contrast to Boeing (BA) which is up 66.3%. Both GE and IBM have attractive yields in the 4% area but a further decline in the stock price could quickly erase the yield benefit. One of the key technical tools I use in my analysis is the relative performance which compares the performance of a stock or ETF to the Spyder Trust (SPY).


When the RS is below its WMA and in a clear downtrend it means that it is weaker than the SPY or S&P 500. Therefore it is likely to perform weaker than these benchmarks. In a very strong market they also can rally but when the market declines the weak RS stocks generally are weaker than the SPY.
General Electric (GE) opened 2017 at $30.85 and the RS analysis turned negative the next week, line a. The Friday close was also below the quarterly pivot at $30.72 and GE has not had a Friday close above the quarterly pivot all year. The RS is still making lower lows and shows no signs yet of a bottom.
The weekly RS turned negative on International Business Machines (IBM) the week ending March 17th (line 2). The RS has continued to make new lows as it is below its declining WMA. Before a bottom is likely the WMA needs to flatten out and turn higher. IBM closed on Friday just barely below the new quarterly pivot at $146.74.


The PowerShares QQQ Trust (QQQ) had one of the best performances last week as it was up 1.5%. It has been lagging for the past few weeks but was finally able to make new highs along with the S&P 500 and small cap Russell 2000.
There is weekly chart resistance in the $149-$150 area with the weekly starc+ band at $152.50. There is quarterly pivot resistance at $153.40. There is initial support now at $146.37 with the rising 20 day EMA at $145.39. The new quarterly pivot stands at $142.61.
The weekly and daily advance/decline lines made further new highs last week. Both are well above their rising WMAs which is a positive sign. The weekly OBV has also improved as it has moved through the bearish divergence resistance at line b.


The Spyder Trust (SPY) tested its daily starc+ band every day last week which means it is in a high risk buy area. The weekly starc+ band is at $256.50 which is just 0.8% above Friday’s close. The initial quarterly pivot resistance has been reached with further at $258.61.
The support zone for the SPY begins in the $250 area as the rising 20 day EMA is at $250.81. The October monthly pivot is at $249.17 with stronger support in the $247.50-$248 area. This is 2.5% below Friday’s close. The new quarterly pivot is at $247.63.
The daily S&P 500 completed its correction at the start of September (see Tweet) when it began the current strong uptrend. It turned down slightly on Friday but is still well above its rising WMA. The weekly A/D made another new high last week which is a bullish sign for the intermediate term.
The Economy


The week started off on a strong note as the ISM Manufacturing Index surged to 60.8 which was a 13 year high and well above expectations. The downtrend in the ISM was broken in early 2016 when stock prices were collapsing. It has been in a strong uptrend ever since.
The PMI Manufacturing Index was not as strong but Construction Spending, that tends to oscillate sharply, was quite strong. The Wednesday report on ISM Non-Manufacturing Index was much better than expected as it hit a three year high.
Banks are closed Monday but the markets are open. The PPI is out on Thursday with the CPI on Friday. Also out on Friday is Retail Sales, Business Inventories and Consumer Sentiment.
Interest Rates & Commodities


The yield on the 10 Year T-Note closed above the downtrend last week with next major resistance at 2.423%, line a. The futures market is now showing a 93% chance of higher yields by the end of the year. The weekly MACD turned positive last week for the first time since the middle of February. There is further resistance at 2.615% and then in the 3.00% area.
There were signs last week that the rally in crude oil was weakening. There is next good support in the $48-$48.64 area, line a. The OBV is now slightly below its WMA but it is still above the more important support at line b.

The Herrick Payoff Index had started to deteriorate a week ago as it had dropped below its WMA. The HPI weakened further last week so the rally on Thursday was just an oversold bounce. A drop below the more important HPI support at line c, would be more negative.
The current correction in the energy ETFs like the Vanguard Energy ETF (VDE) and SPDR S&P Oil & Gas (XOP) should be a buying opportunity for Viper ETF clients.
What to do? As the stock market started to accelerate on the upside last week the individual investors are not yet convinced. The latest AAII survey showed that the bullish % rose just 2.3% to 35.6% while the bearish % rose 4.1% to 32.8%.
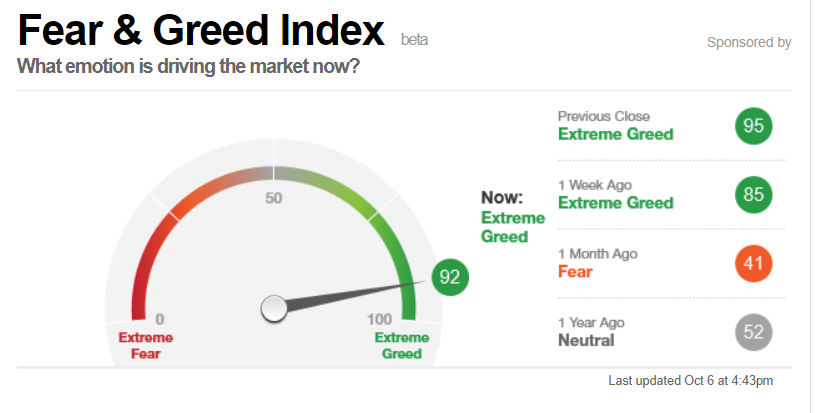
The CNN Fear & Greed Index closed at 92 and was in extreme greed territory all last week. It is at its highest level since 2015. Just a month ago it was at 41 which was slightly in fear territory.
Not all of the components of this index actually measure sentiment as several just reflect bullish momentum that should be rising sharply in a strongly positive market.
There are a number of ETFs where Viper ETF clients have taken some profits as the risk seemed to be too high at current levels. There are a few ETFs that have not moved with the overall market but they will look attractive for purchase once new buy signals are generated.
A sharp 2-3% pullback is still expected in the next week or two. This I think will be a buying opportunity in some of the market leading ETFs. Since a decline may be brief I think it will be important to have resting buy orders below the market.
It is a bit easier to find stocks that are just starting to rally from good support but once we get into earning’s season traders will have to be more nimble. Viper Hot Stock traders continue to scale out of long positions once strong resistance levels are reached.
In my Viper ETF Report and the Viper Hot Stocks Report I provide market analysis twice a week along with specific buy and sell advice. I also teach clients about the markets for only $34.95 each per month.
Comments
comments