

The stock market spent most of last week trying to decide what the weak June jobs report meant for the stock market and the economy. The strong action of the S&P 500 early in the week and the ability to close at 2119 last Wednesday did not appear to convince many market skeptics to change their tune.
There was little in the way of economic data to move the market last week but the sharp decline in global yields had many scratching their heads. A recent article by noted technical analyst Louise Yamada "Professionals Confused Over Stock Market" highlighted the quandary for investors. She proposed "three scenarios likely to emerge: a 40 percent chance of a trading range forming, a 40 percent chance for a breakout to new highs, and a 20 percent chance for a resumption of the bear market."
Another force that I feel is driving the markets is the fear of some money managers who have been fighting the market rally this quarter. Those who have been underinvested may have to face unhappy investors once the quarter draws to a close. This could trigger another flood of buying before the end of the month.
The news that George Soros was worried about a large stock market decline did increase the level of bearish commentary, As I mentioned in early May " The Bubble No One Is Discussing" many other hedge fund managers had expressed bearish views at the Sohn Conference but I also pointed out that many hedged funds have not performed that well lately.
In fact a MoneyWatch article last week detailed what the market did in the past when news of a bearish outlook from George Soros hit the tape. Friday's comments from bond trader Bill Gross that "negative yields will lead to ‘supernova’-like market implosion" added fuel to the fire. As I advised last week " Investors - Look Before You Leap" that it is important to view any current market comments in the context of the analysts long-term record.

Many fundamental analysts can't explain why stock prices are so high when the economy is not that strong and rates are dropping. Some have wondered whether a Black Swan event might be the catalyst for another sharp market decline. This concept gained prominence after the book "The Black Swan: The Impact of the Highly Improbable by Nassim NicholasTaleb was released in 2007.
The Black Swan history goes back to the 16th century and Taleb provided the following criteria for a Black Swan event.
The event is a surprise (to the observer).
The event has a major effect.
After the first recorded instance of the event, it is rationalized by hindsight, as if itcould have been expected; that is, the relevant data were available but unaccounted for in risk mitigation programs. The same is true for the personal perception by individuals.
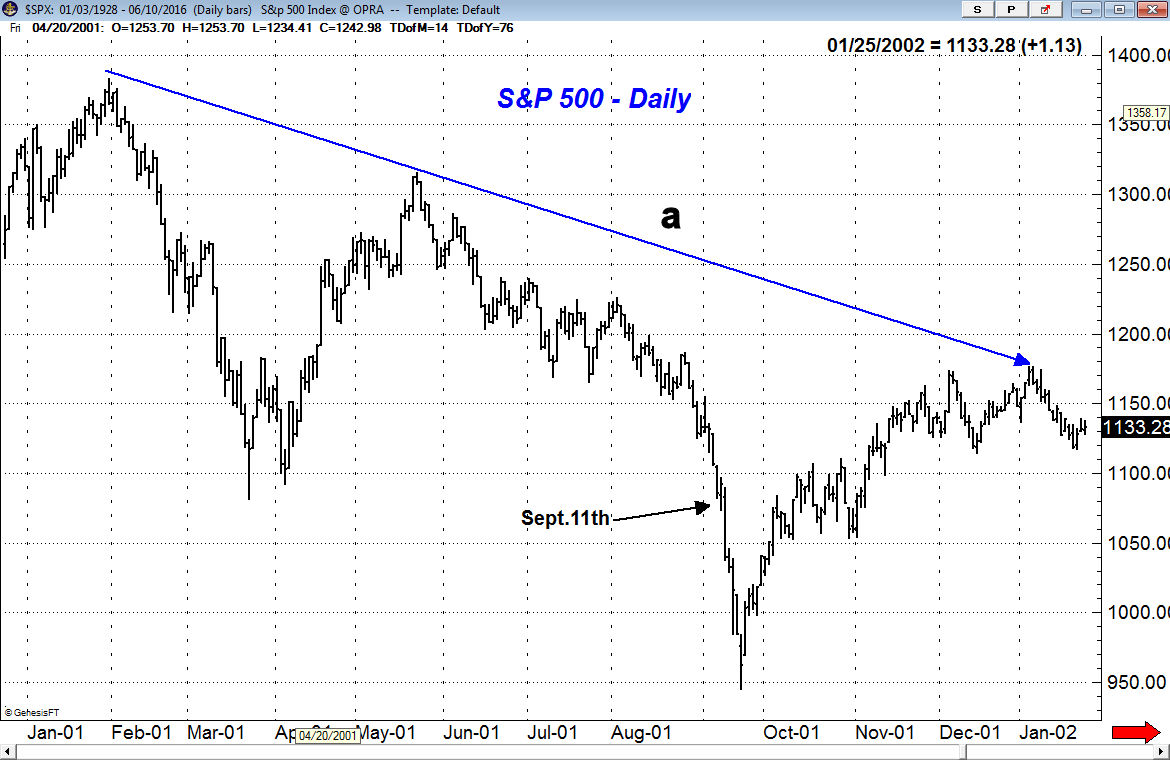
The tragedy of September 11th unfortunately fits the Black Swan criteria and has of course has had long term implications for the world as well as investors. As the chart indicates the S&P 500 was already dropping sharply at the time and was in a well-established downtrend. The concern that other such events may occur has since been a deterrent to some investors but is there anything investors can do to protect themselves or plan for such future events?
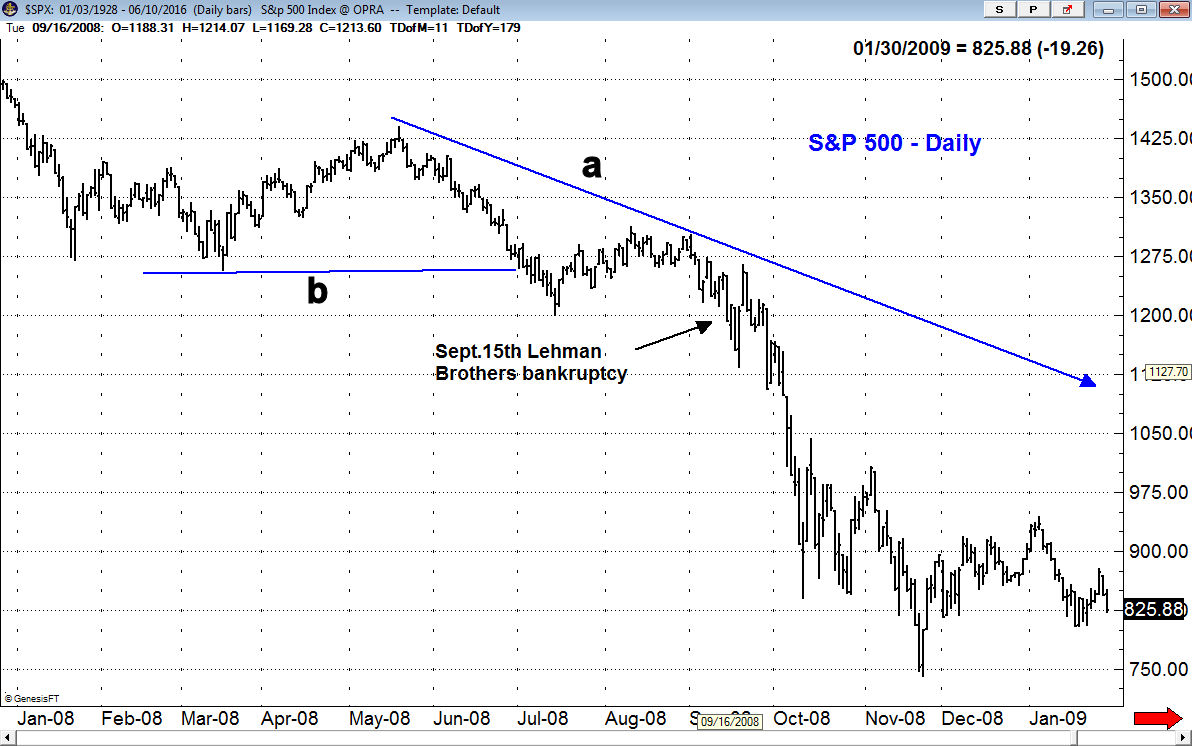
For investors the sudden bankruptcy filing by Lehman Brothers on September 15, 2008 was also unexpected and had serious ramifications for investors. The S&P 500 had broken support, line b, in July and showed a clear pattern of lower lows and lower highs, line a. The weak rebound from the summer lows had ended by early September. The market internals had indicated that a bull market top had been completed at the October 2007 highs.
The stock market's intermediate term outlook I feel is an important factor in an investor's ability to minimize the impact of future Black Swan events. I encouraged investors in my late February article to not let the "wall of Worry" keep them from investing in stocks.
Others would put the flash crash of May 5 2010 on this list as the Dow Industrials plunged almost 1000 points within minutes before it recovered as it the entire event lasted only 36 minutes. In a CFTC report this crash was described as "one of the most turbulent periods in the history of financial markets". Five years later the US Department of Justice filed extensive criminal counts charging an individual for helping to cause this crash.
This sharp decline, unlike the others, took place as part of a correction in a bull market. In my market timing I place a major emphasis on the monthly, weekly and daily analysis of the advance/decline lines. In both 2001 and 2008 the weekly A/D lines were below their WMAs which put the market in the correction mode.
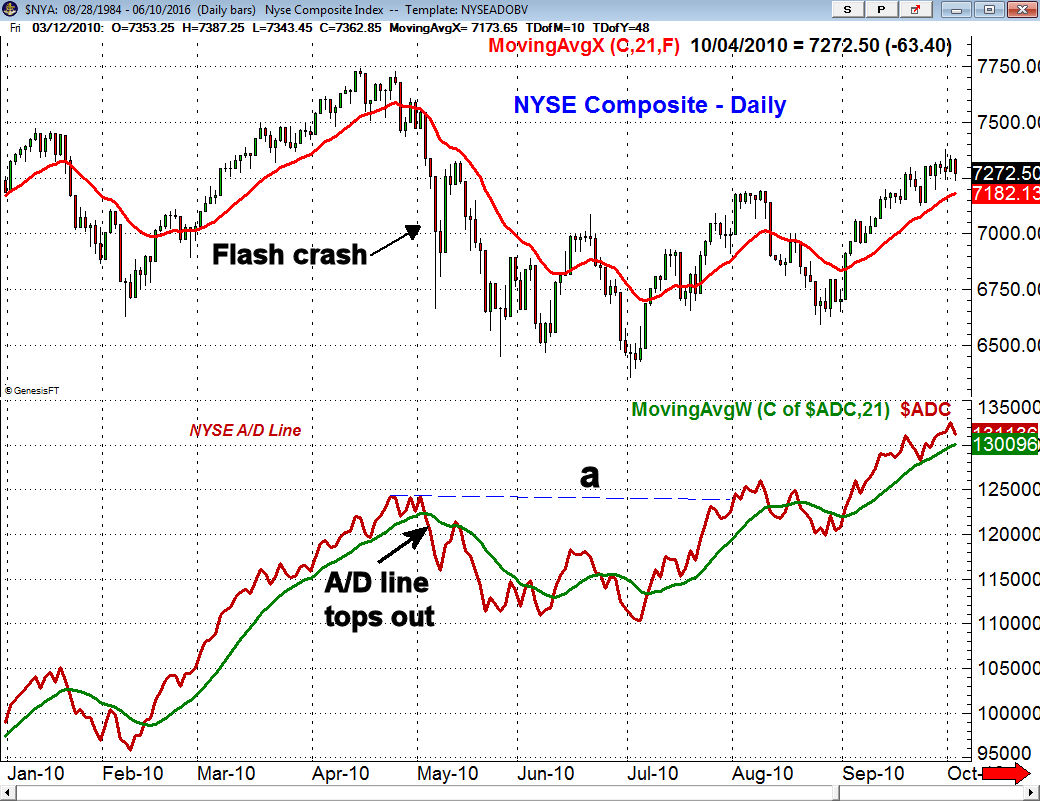
In 2010, the daily A/D line was dropping sharply in the days before the flash crash but had just made a new bull market high the previous month. This reaffirmed the positive intermediate term trend and by early August, the A/D line had made a new bull market high as it had moved above the previous peak (line a).
When the intermediate market trend is negative then clients of the Viper ETF Report and Viper Hot Stocks Report would be advised to take no new long positions and traders would be looking at the short side. In a bear market only a maximum of 20% would be in long stock funds or ETFs as typically there will be some sectors that buck the trend even in bear markets.
Of course in that environment inverse ETFs would also be recommended. In this way investors should be cushioned from the serious damage that a Black Swan event could cause in a bear market.
Those investors that are uncomfortable about large market swings I would suggest that you keep no more 80% invested. In that way you will have some cash available to buy if the market has an unexpectedly sharp correction.(To learn more about A/D line analysis I have posted an excerpt from a recent Viper Trading lesson here )
Of course currently the largest worry on the near term horizon in the Brexit vote on June 23rd where the citizens of the UK vote as to whether they want to stay in the EU or not. The market decline was blamed in part on the thought that a no vote was now more likely and that this could lead to the collapse of European Union.
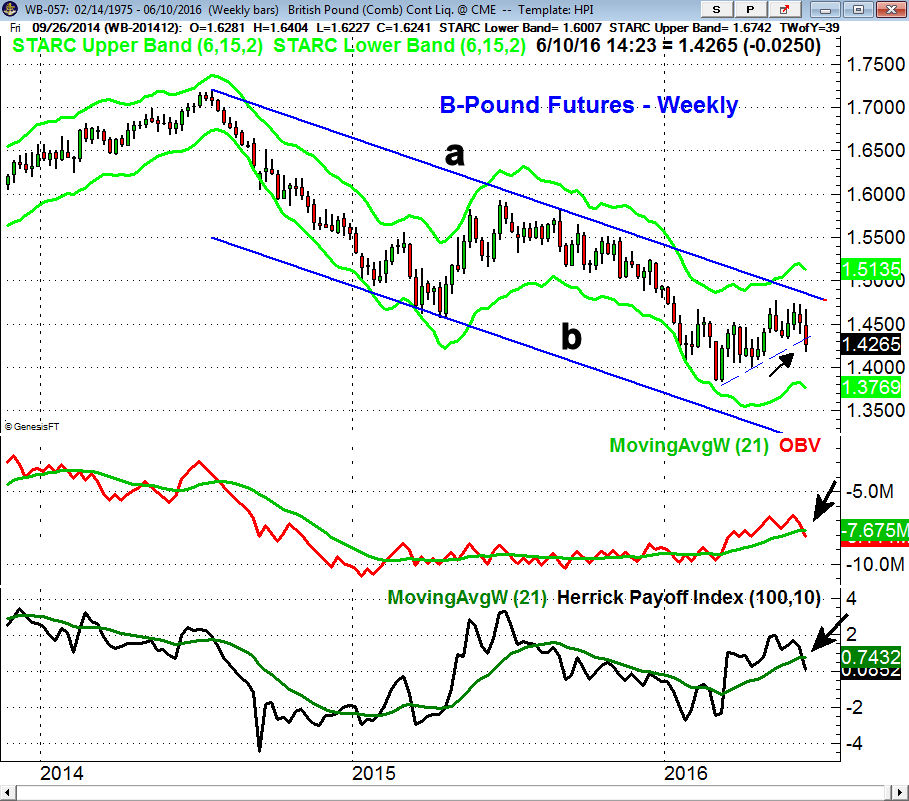
The polls are now very close but the technical action suggests that the British Pound is likely to stay weak as it closed below its near term weekly uptrend on Friday. The longer-term chart shows a well-established downtrend, lines a and b. The OBV and HPI have just dropped below their WMAs which is a sign of weakness.
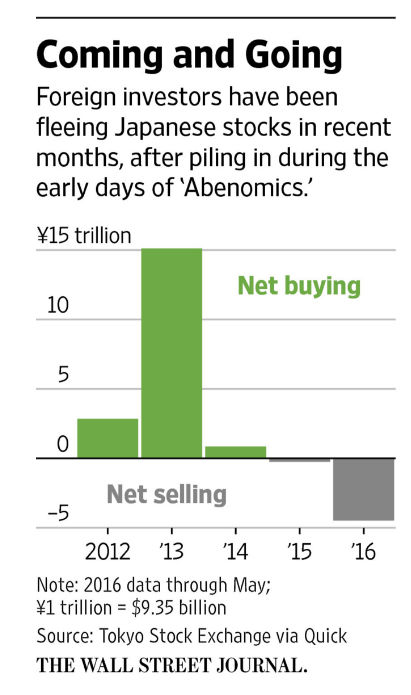
The recent data suggests that some foreign investors are also giving up on Japan's recovery as they have pulled $9 billion of Japanese stocks this year through May. However even more was invested in 2012 and 2013 so overseas investors still have a sizable long position.
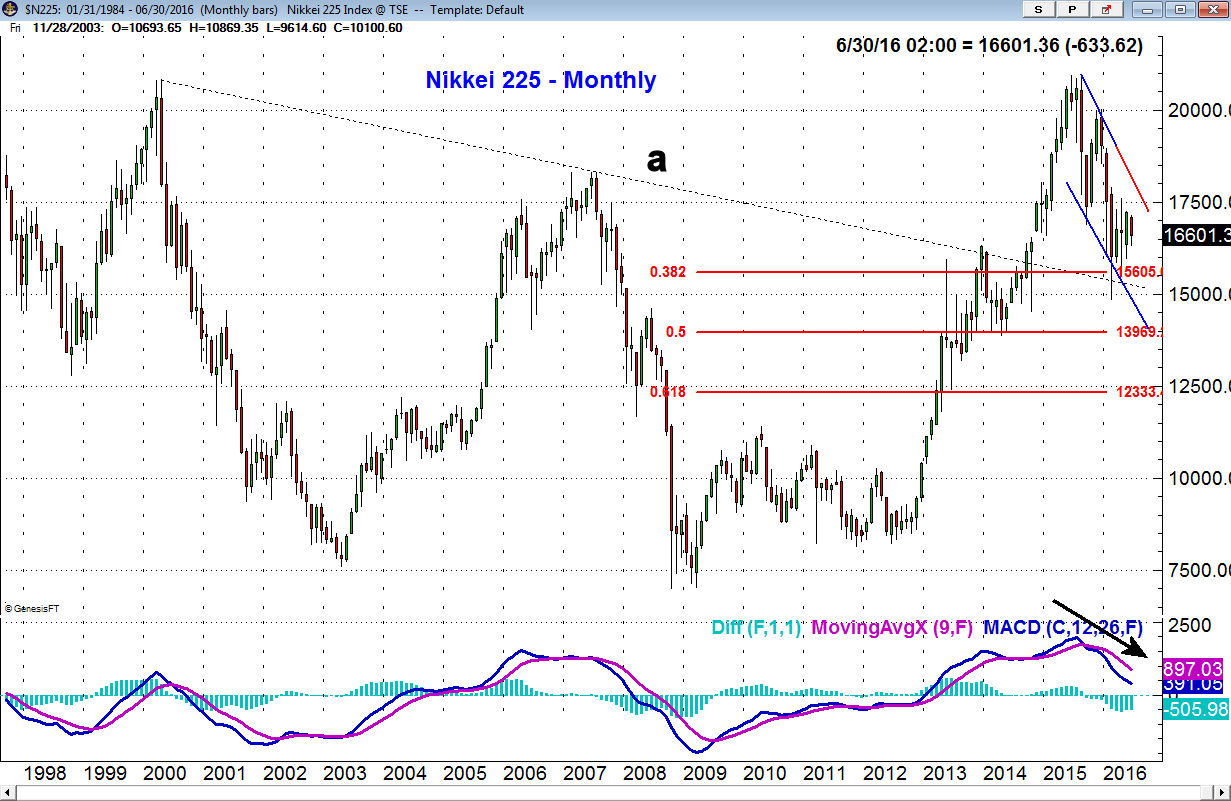
The monthly chart of Japan's Nikkei 225 shows that it topped out last summer and in early 2016 the 38.2% support level was tested. It is positive that the major downtrend from the 2000 and 2007 highs, line a, was broken in late 2014. The MACD is still negative so we may see another drop to the 15,500 level and this would be a retest of the breakout level. I would look for the NK225 correction to be over by later in the year.
The Economy
The Consumer Sentiment last Friday held firm at 94.3 which is only a bit below May's reading. This Tuesday the FOMC meeting starts and we have Retail Sales, Import and Export Prices along with Business Inventories. On Wednesday we have the PPI, Empire State Manufacturing Survey, Industrial Production along with the afternoon FOMC announcement as well as Janet Yellen's press conference.
The Philadelphia Fed Business Outlook Survey is out on Thursday, along with the CPI and Housing Market Index. On Friday we have quadruple witching and Housing Starts.
Interest Rates and Commodities
The focus for many last week was the very low level of global rates as the yield on the 10 Year T-Note fell to the lowest level in three years. The bonds from Germany, Japan and the U.K. also dropped to new lows with the yield of the German Bunds hitting a low of 0.01%.
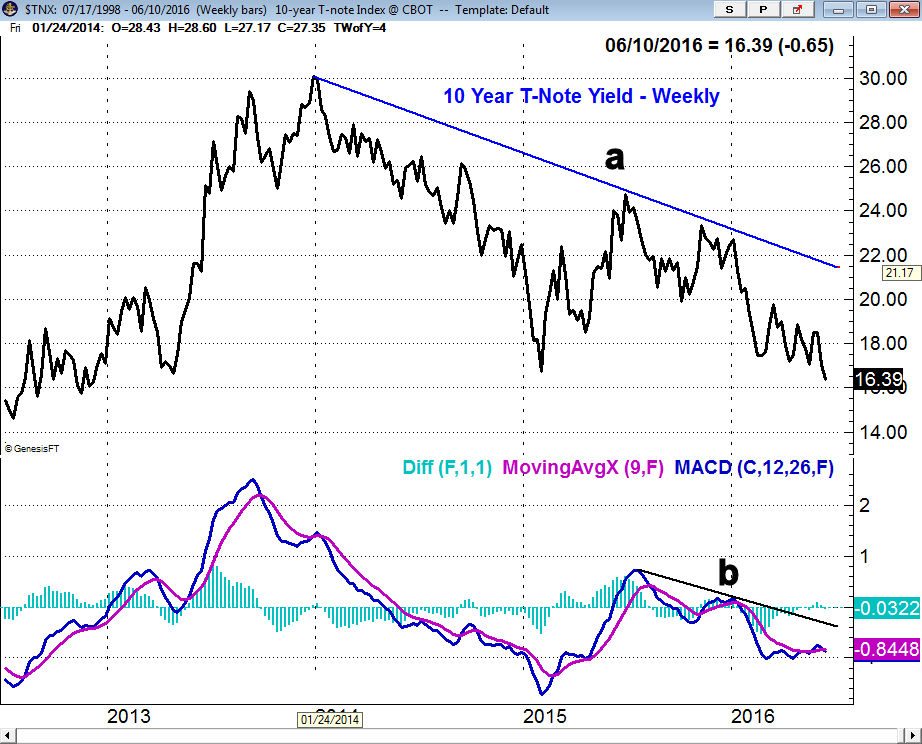
The weekly chart of the T-Note yield shows the drop to new lows for the year but it is still above the lows from 2012. The weekly MACD has been negative since early in the year as it shows a well-defined downtrend (line a) and it has been projecting a further decline in rates since the start of the year. The daily technical studies dropped sharply late last week which favors even lower yields.
The move away from risky assets into bonds has some concerned about the stock market but I think much of the demand for our T-Notes comes from overseas because of the wide gap in yields. Therefore I do not think the plunging yields are necessarily forecasting an even weaker economy.
The US dollar is also one of the world's strongest currencies which is also a plus for overseas investors. The dollar index had dropped sharply since the start of June but turned up on Friday and the daily technical studies do allow for a further dollar rally.
Crude oil dropped $1.50 on Friday but was still slightly higher for the week. A gravestone doji was formed which is a negative formation even though the weekly studies are still positive. There are many resource ETFs that look interesting on a pullback. In last week's article I focused on SPDR S&P Metals & Mining ETF (XME) which I was only looking to buy on a pullback.
Market Wrap
In spite of the markets drop on Friday the Dow Industrials still managed to close up 0.3% on the week while the S&P 500 lost three points. The selling was heavier in the Nasdaq Composite as it was down 1%. The market internals were positive again last week.
The financial stocks were hit the hardest as the sector was down 1.3% for the week followed by a 0.90% loss in health care. Technology and consumer service stocks were also lower. The telecommunication stocks performed the best as they gained 2.5% for the week with oil & gas stocks up 1.4%.
In the latest survey from AAII the % of bullish investors declined 2.6% to 27.8% while more moved into the neutral camp. Despite the S&P 500 close above 2100 there are a large number of bears as my in box was flooded by bearish market commentary. My favorite focused on how bad the next bear market will be but then stated that the S&P 500 could move higher for several more months or even years.
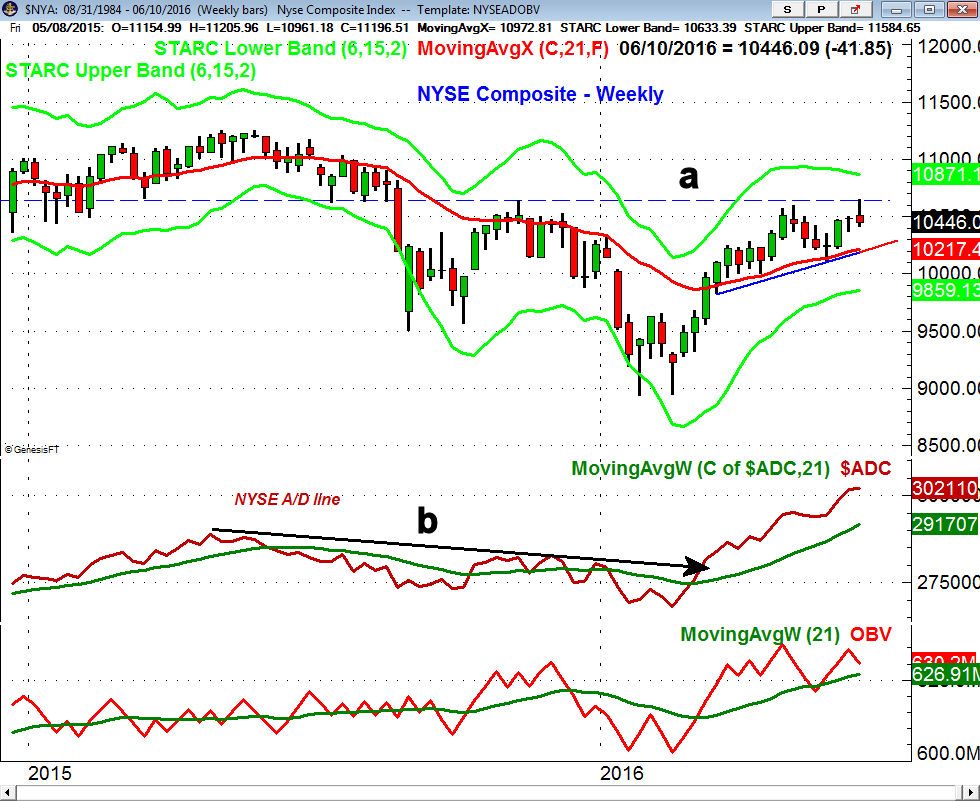
The NYSE Composite reached the late 2015 highs last week, line a, before turning lower. The 20 week EMA at 10,217 now represents strong support. The NYSE Advance/Decline line is still rising and is in a solid uptrend. The daily A/D line (not shown) made a new high last week and despite the 4-1 negative A/D numbers on Friday is still above its WMA. The McClellan oscillator has dropped back to -42.
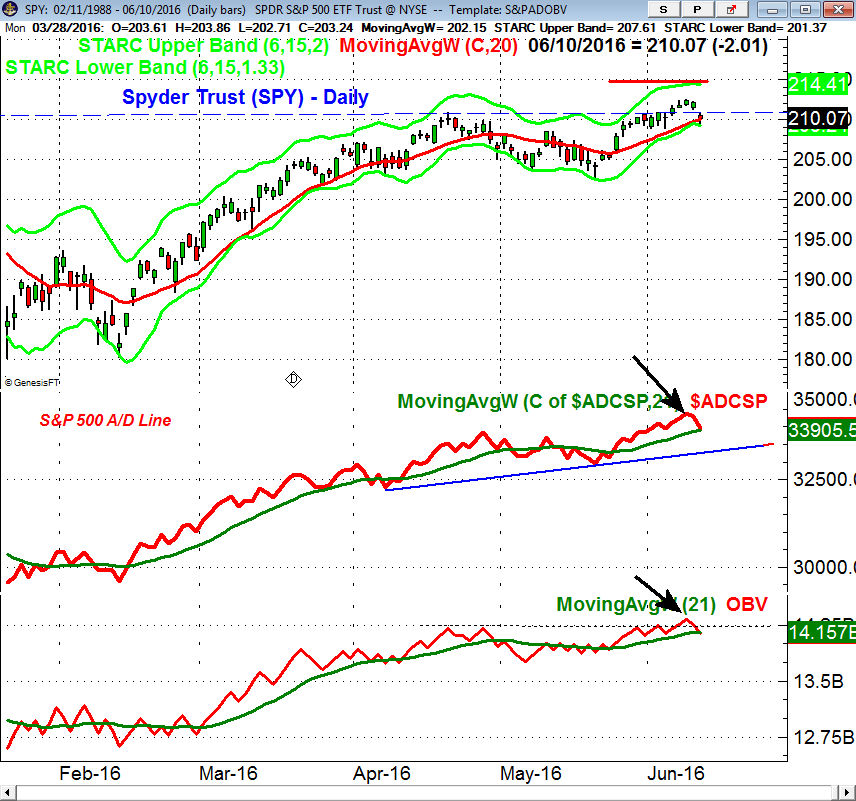
The Spyder Trust (SPY) closed just above the 20 day EMA at $209.94 with the daily starc- band at $209.24. The monthly pivot is at $207.77 with stronger daily chart support at $206.60. The S&P 500 A/D line made a new high last week and is now just above its rising WMA. It is still above the breakout level from late May. The daily OBV also confirmed the new price highs but has not pulled back.
The iShares Russell 2000 (IWM) is still leading the PowerShares QQQ Trust (QQQ) and it has good support in the $114-4115 area which is not far below Friday's close. The Russell 2000 A/D line (not shown) did make a convincing new high last week and the weekly relative performance still looks very strong.
What to do? I have been expecting the market to pullback for the past week and I was not surprised that it was enough to turn some short-term traders bearish. It would take a much more severe decline and a drop in the A/D lines below key support to turn the daily analysis negative. If this is just a pullback in the uptrend the stock market should continue higher in the next week.
More importantly it would take some time and much further signs of distribution to reverse the positive signals from the monthly and weekly A/D lines. I still would not be surprised to see the S&P 500 reach the 2200 level and 2300 in 2016.
Therefore long term investors should continue to look at broadly based ETFs that have low expense ratios. There are a number of market leading ETFs that have been recommended in Viper ETF for purchase at good support. Also there were a number of Nasdaq 100 and IBD Top 50 stocks that gave new buy signals last week.
Comments
comments