

The FOMC announcement Wednesday means that all of us will be spared from Fed babble for a few months. I hope many investors took my advice and avoided the incessant discussion by hitting the mute button. The market did issue its verdict as the technical action sent a strong signal that the market's correction was over.
It has been a difficult few years for the hedge funds as well as the individual investor. Preliminary data on over 2600 funds suggests they are up on average just 3.4% so far in 2016 which was less than half the YTD performance of the Spyder Trust (SPY). The market's sharp decline early in the year understandably scared many investors out of the stock market and the low yields have limited their returns.
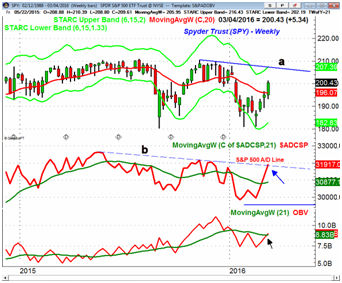
The chart from the Viper ETF report on March 7th shows that the S&P 500 A/D line moved above its downtrend with the close at $200.43 indicating the weekly trend had turned positive. Since then the Spyder Trust (SPY has gained just over 8% while the PowerShares QQQ Trust (QQQ) is up 13.3%.
The stock market this week appears to have confounded the many big name investors who warned of an imminent market crash. They will be right at some point but there are no signs of a bear market or recession on the horizon. Most investors expect these smart money investors to outperform the market averages so they were likely surprised by the results of Harvard's Endowment Fund for the fiscal year that ended in June.
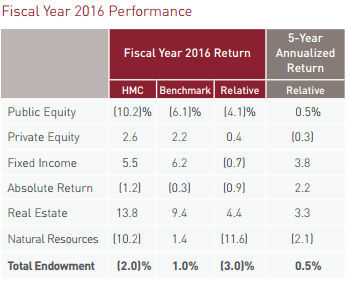
The table shows that they lost 2% and have a 5 year annualized return of just 0.5%. They were hurt by a 10% loss in their trading of public stocks and also by their natural resource holdings. The Boston Globe commented "For the 12 months ended in June, Harvard's 2 percent loss compared with a 2.3 percent gain in a hypothetical portfolio of 60 percent global stocks and 40 percent global bonds. If the money had been invested just in the US stock market, it would have gained 5 percent..."
Apparently a couple of top traders each lost $20 million and were automatically stopped from further trading. This suggests their investment choices were determined through fundamental analysis as most sound technical approaches would typically have more stringent risk control measures.
The record compensation paid to Harvard's portfolio team is now getting much more attention and in June they reduced the size of their internal equity team. Their current endowment chief Stephen Blyth left in June after being paid $11 million in 2013. The president of Harvard is reported to have made just over $1 million.
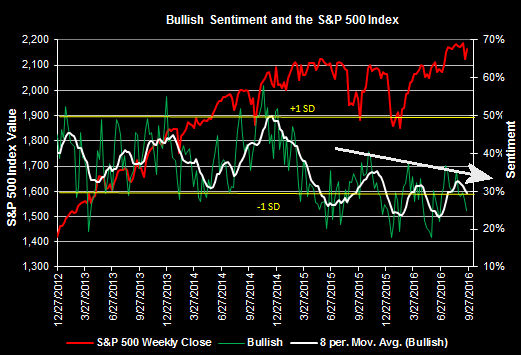
Stories like this are not going to help the individual investors already low bullish sentiment as the bullish % dropped 3.1% last week as I noted in Thursday's Tweet. I have added an arrow to this chart from a Seeking Alpha article to better highlight the decline in bullish sentiment as the market has moved higher. This suggests the market has plenty of room to move higher before the bullish sentiment will reach an extreme level.
As I pointed out in Augusts' column "The Week Ahead: What's Missing From This Bull Market?" since the bull market started there has not been really an period when investors were euphoric. In John Templeton's well known quote bull markets end when investors become euphoric and this was clearly the case in 2000 and 2007.
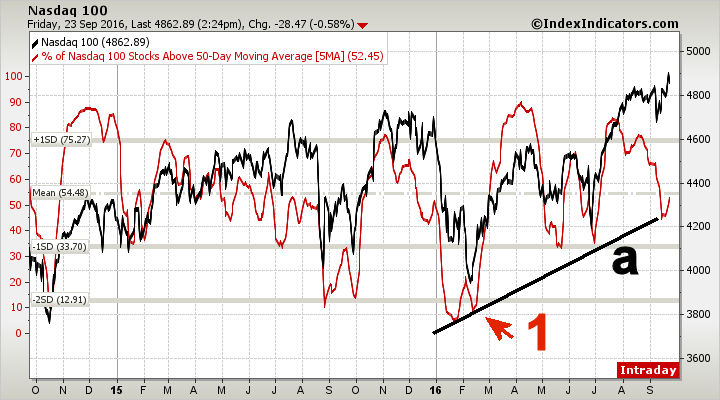
The apparent low level of bullishness appears to coincide nicely with several measures that indicates stocks are again moderately oversold. One that is frequently mentioned in the Viper Hot Stock Report is the 5-day moving average of the Nasdaq 100 stocks that are above their 50 day MA. At the February lows (point 1) the bullish divergence added to the weight of the evidence that the market had bottomed.
The 5 day MA has dropped below the mean and tested the uptrend, line a, before turning higher last week. This supports further gains for the QQQ. The same analysis on the S&P 500 reveals that the 5 day MA has turned up from 1 STD Deviation below the mean and it is even more oversold .
Though the market averages have been range bound and choppy the scans of the Nasdaq 100 and IBD Top 50 stocks are still coming up with good trades. Some of the strongest ETFs from early in the year have closed back above their quarterly pivots on Friday.
The Economy
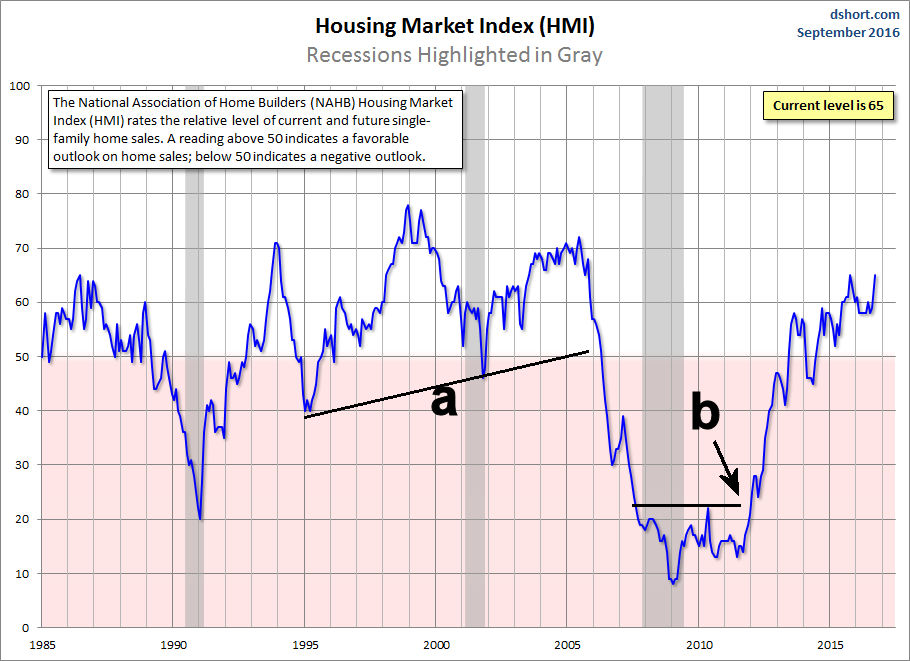
The Housing Market Index surged six points as the builders are showing the highest optimism since last October. A bottom was completed in 2011 as the resistance at line b was overcome (as I noted at the time in Forbes) The HMI shows a very powerful uptrend with no signs of topping out. The HMI violated support in early 2006 (line a) warning well in advance of the housing crisis.
Housing Starts were down but permit growth suggested good housing demand. The Chicago Fed National Activity Index was down and lower than expected. Existing Home Sales were also soft on Thursday and the all-important Leading Indicators were down 0.2%.
Existing Home Sales were down 0.9% in August as supply is still tight but condo sales were strong for the month. The flash PMI Manufacturing Index was a bit lower than expected at 51.4 as new orders and employment were weaker.
On Monday we have New Home Sales and the Dallas Fed Manufacturing Survey followed by S&P Case-Shillar HPI, flash PMI services index and Consumer Confidence. On Wednesday we have the latest report on Durable Goods followed on Thursday by the final reading on 2nd quarter GDP and Pending Home Sales. Then on Friday we have the Chicago PMI and Consumer Sentiment.
Interest Rates & Commodities
The yield on the 10-year T-Note dropped last week to close at 1.615%. This has been quite a reversal in yield as it had closed on September 13th at 1.734%. There is next yield support in the 1.550-1.570% area.
Crude oil was hit hard on Friday as it dropped 4% on concerns that Saudi Arabia and Iran are still at odds over oil production. Still crude did close the week higher and the daily studies are starting to suggest that prices have bottomed.
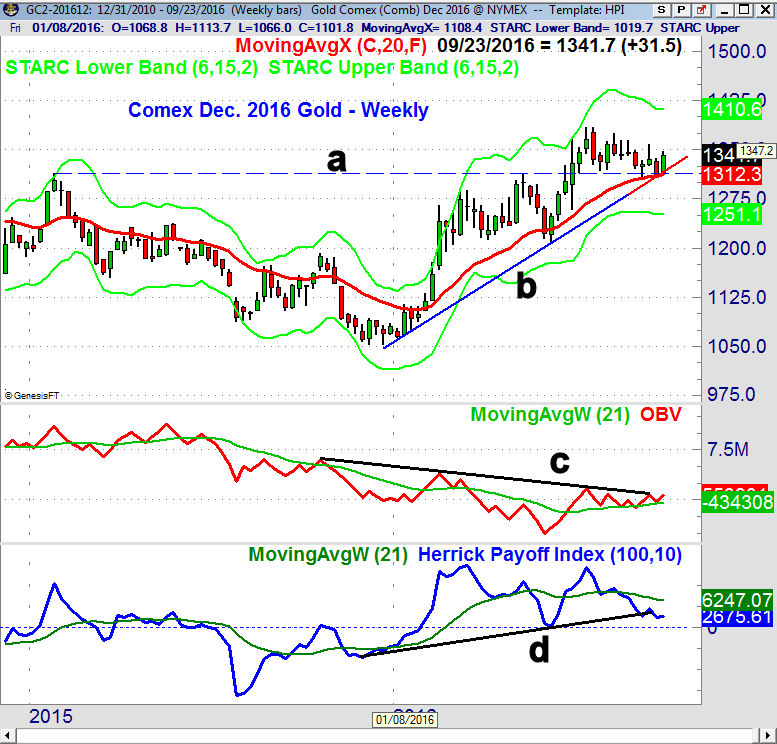
The December Comex Gold contract tested the early 2015 highs (line a) and the uptrend from the late 2015 lows, line b, before closing higher last week. This suggests that the correction may actually be over as the quarterly pivot support was tested along with the 20 week EMA.
The weekly on-balance-volume (OBV) has been holding above its WMA for the past 10 weeks and is on the verge of breaking through resistance at line c. The weekly HPI is close to breaking below the support at line d but is still well above the zero line. The daily studies need a strong close above $1358 to turn solidly positive.
Market Wrap
The A/D lines were in trading ranges before the FOMC announcement on Wednesday and it would taken several down days to drop them below key support. . The upward resolution in the major averages last week was confirmed by the A/D lines which made new highs.
The Dow Utilities were up 3.3% for the week followed by a 2.4% rally in the small cap Russell 2000. The Dow Transports were not far behind up 2.1% while the S&P 500 was up 1.2%. The advance/decline numbers were strong as 2500 stocks were up with just 635 declining.
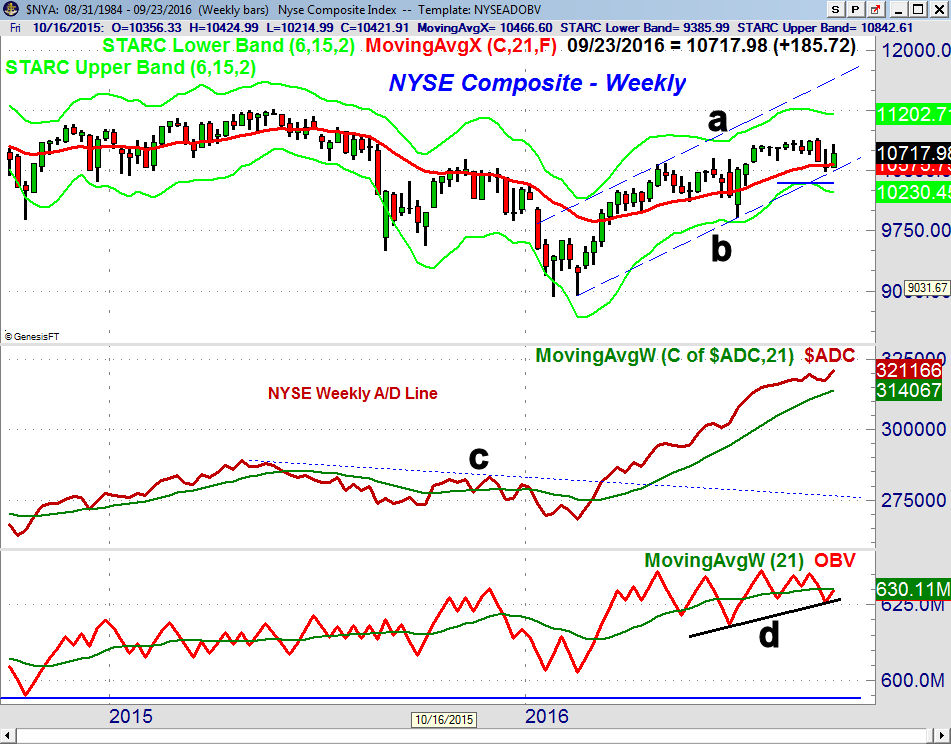
The NYSE Composite closed a week ago right on its 20-week EMA and tested the year long uptrend, line b. This set the stage for last week's rally with next resistance in the 10,900 area. The weekly starc+ band is at 11,202 and the 2015 high stands at 11,248. The upper boundary of the trading channel, line a, is in the 11,600-700 area.
The weekly NYSE Advance/decline line after a slight pullback made a new high last week which is a bullish sign. The move through the A/D line resistance at line c, in early March confirmed the current buy signal for the stock market. The OBV has turned up and is now just barely below its WMA.
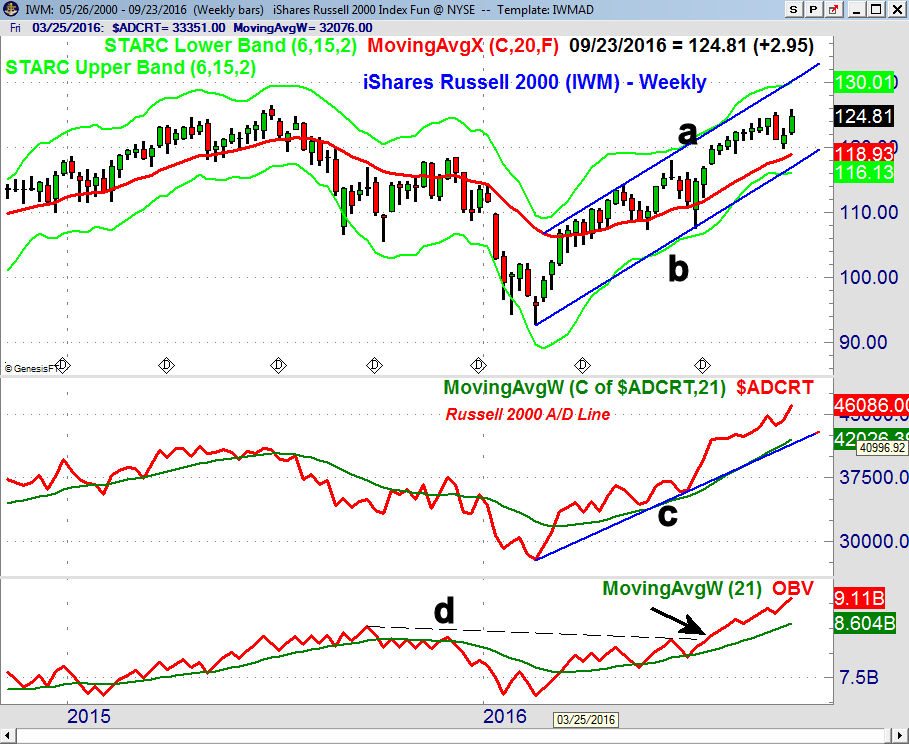
The iShares Russell 2000 (IWM) had a high last week at $125.88 which was not far below the all time high at $126.56 from June 2015. The weekly chart has initial support now at $119.88 with the rising 20 week EMA at $118.93. There is weekly support, line b, in the $117 area with resistance (line a) at $130.
The Russell 2000 A/D line held up well on the recent drop and has now moved well above the previous high. It is well above its rising WMA and the support at line c. The weekly OBV staged a major upside breakout in July as it overcame the resistance at line d. It continues to lead prices higher. The relative performance analysis indicates that IWM and QQQ are both market leaders.
What to do? The breakout of the trading ranges in the A/D lines Wednesday was confirmed by the new highs based on both the daily and weekly analysis. Despite Friday's pullback this action does indicate that a new market rally is now underway. It would take a daily close under the September 13th lows to change this view.
It is over two weeks before the official start of the earnings season and I still expect this earnings season to exceed expectations. Stronger earnings should help individual investors to justify new stock purchases and create the environment for a higher stock market as we head into the end of the year.
Investors should use any market weakness to add to long positions for a year end rally and I continue to like the technology, biotech and small cap stocks.
Viper ETF traders closed out longs in SPY on August 17th at $218 and then bought the IWM and QQQ on the recent pullback. Investors are still long the SPY as well as a number of sector ETFs. There should be some new opportunities in market leading ETFs over the next several weeks. Last week four country ETFs generated new buy signals.
The Viper Hot Stock traders are now holding more long than short positions as some of our short positions were closed out on the recent market weakness. After Friday's there were over twenty stocks that generated new buy signals.
Each service is only $34.95 per month and includes regular trading lessons as well as the twice a week market analysis and specific recommendations. New subscribers receive four of the most recent trading lesson and subscriptions can be cancelled anytime on line.
Comments
comments