

As the new president officially is sworn in the stock market is holding on to half of its early gains as of 1:00 PM New York Time. The background and experience of the president is much different than any other in modern history.
Many Republicans would like to compare him to President Reagan as they view it has the gold standard for Republican presidents. Other than their background in the entertainment industry there are many differences that they bring to the table. Nevertheless Reagan's election did shake up the political landscape in 1980.
Some are hoping that the stock market will match the 113% gain the S&P 500 had during Reagan's two terms. It is likely many of you were not in the markets thirty-six years ago so I thought it might be informative to take a technical look at the Reagan markets.
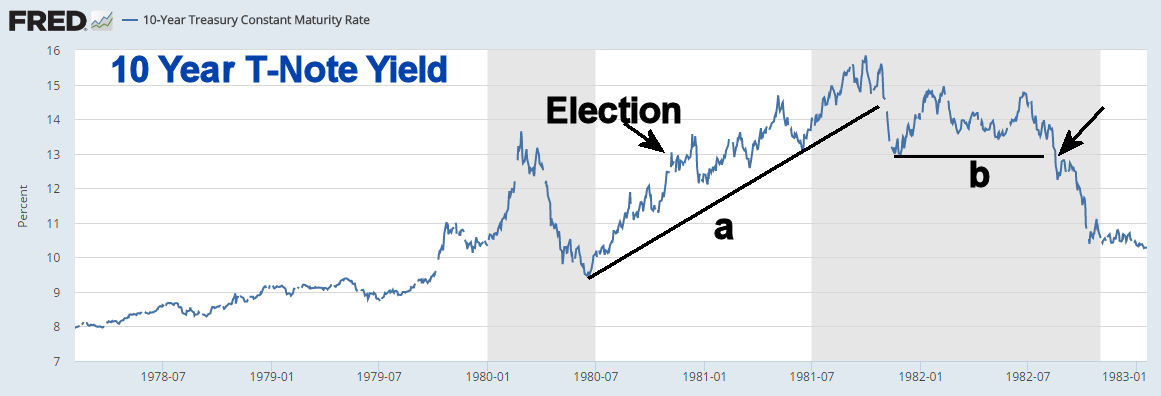
Many things were different in the 1980s especially interest rates. The chart shows that 10 Year T-Note yields were in a gradual up trend in 1977 through 1979 but then surged in late 1979 from 9.34% to a high of 13.75% in February 1980. Because of increasing inflation Fed Chairman Paul Volcker had started to raise rates. As the shaded period indicates the US economy officially entered a recession in January 1980.
Just four months later yields had dropped back to 9.63% in June as the economy improved and the recession ended, But then rates started to rise once more. As the 1980 election was taking place yields were back above 13% as they peaked in October 1981 at 15.75%.
The support on the yield chart going back to 1980, line a, was broken in November 1981 and yields quickly dropped back to 13%. It was the violation of this support, line b, in August 1982 that completed the top in yields and started the thirty-four year bull markets in bonds. The recession was officially over in October 1982.
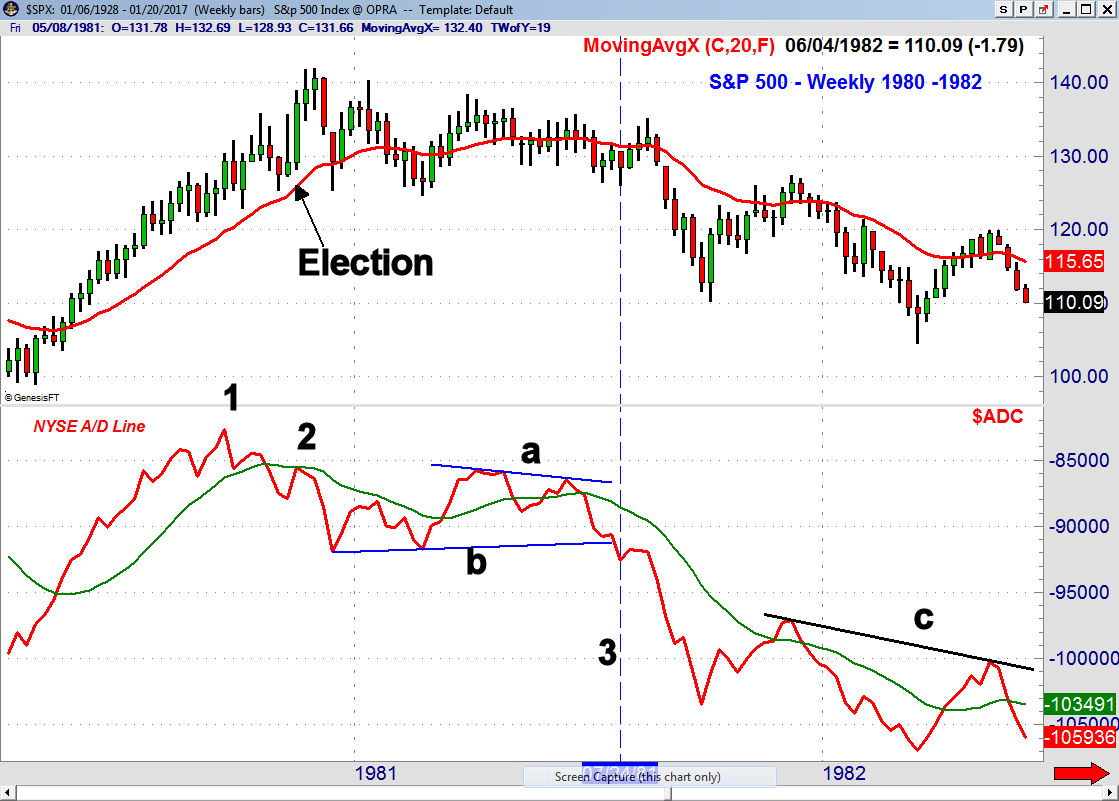
The S&P 500 closed before the election at 129.04 and sixteen days later it had a high of 141.96 which was a gain of 10%. The S&P tried to rally in early 1891 but this rally failed and the S&P 500 continued to form lower highs.
The NYSE advance/decline line moved above its WMA in May 1980 and started a very strong uptrend. It peaked in September (point 1) and when the S&P 500 was making a new high in November the A/D line formed a negative divergence at point 2 as it just rallied back to its flat WMA. It subsequently dropped below the prior low which confirmed the negative divergence.
The A/D line moved back above its WMA in March but failed to move above the November a high which was a sign of weakness. The A/D line formed a lower high again in June (line a) before it started to drop sharply. The drop below the key support (line b) came just before a three week rally, line 3, which set the stage for the sharp six week plunge.
The A/D line formed lower highs in 1982, line c, which was consistent with a bear market. At the August 1982 low the S&P 500 has dropped 28%.
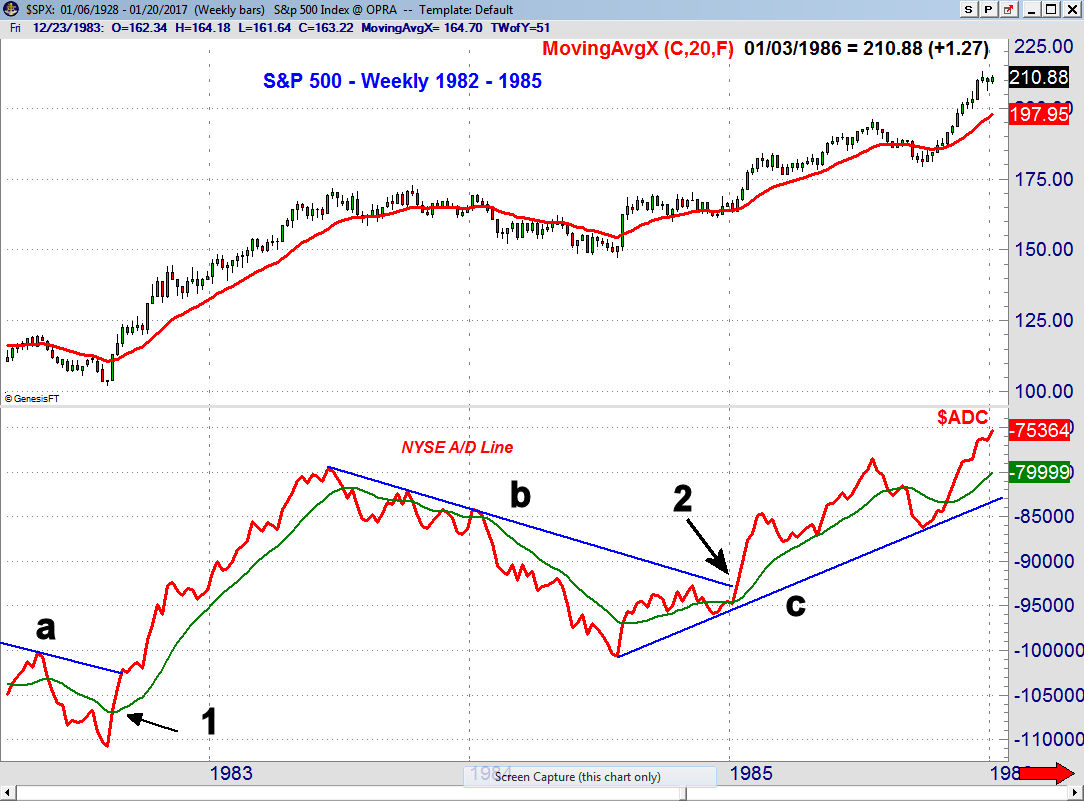
The NYSE A/D line moved above its WMA on August 20th and four weeks later it overcame the downtrend, line a, which confirmed the market bottom. The A/D stayed in a very bullish trend until July of 1983 as it gained 45% after the A/D line buy signal.
In October 1983 the A/D line formed a negative divergence as it failed to make a new high with prices, line b. This downtrend was not broken until early 1985 which was a strong signal that the market's long correction was now over.
The new uptrend in the A/D line that connected the 1984 lows (line c) was not broken until early September of 1987. This negative signal occurred almost a month before the crash in October 1987. The A/D line had formed a significant bearish divergence before it broke support.
The weekly and daily A/D line analysis plays an important role in both my Viper ETF Report and the Viper Hot Stocks Report. It is used to help decide when to be a buyer or seller of both ETFs and stocks.
Many do not realize that according to the Federal Reserve on the Recession of 1981-1982 "Prior to the 2007-09 recession, the 1981-82 recession was the worst economic downturn in the United States since the Great Depression. " It was of course exacerbated by the short recession in 1980.
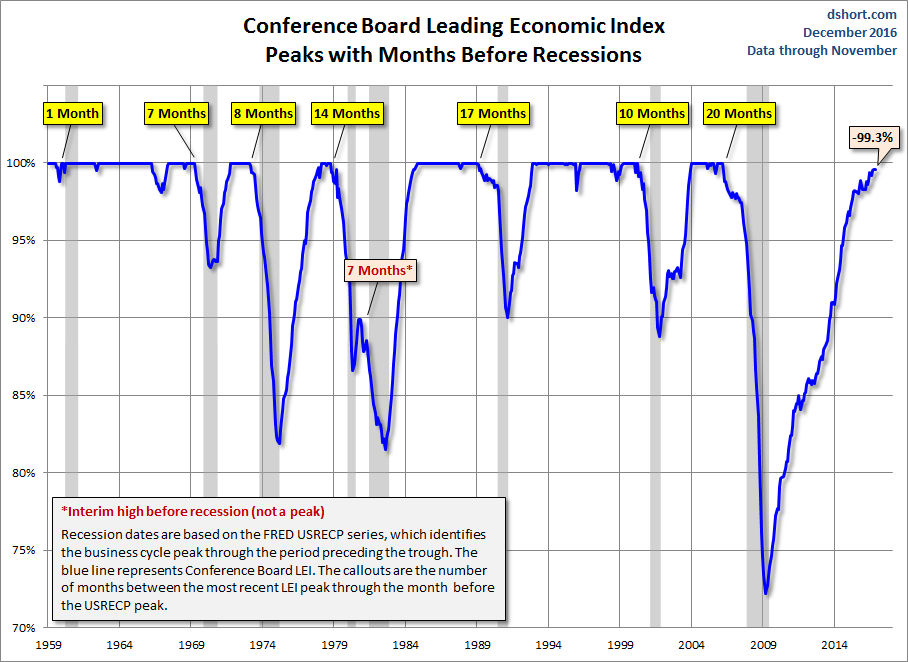
One of the economic indicators that I follow very closely is the Conference Board's Leading Economic Index. It has done a good job of topping out well ahead of a recession as this chart from dhort.com illustrates. It topped out fourteen months before the 1980 recession and 7 months before the 1981-1982 recession. It is still rising as of December and the latest data is out on January 26th.
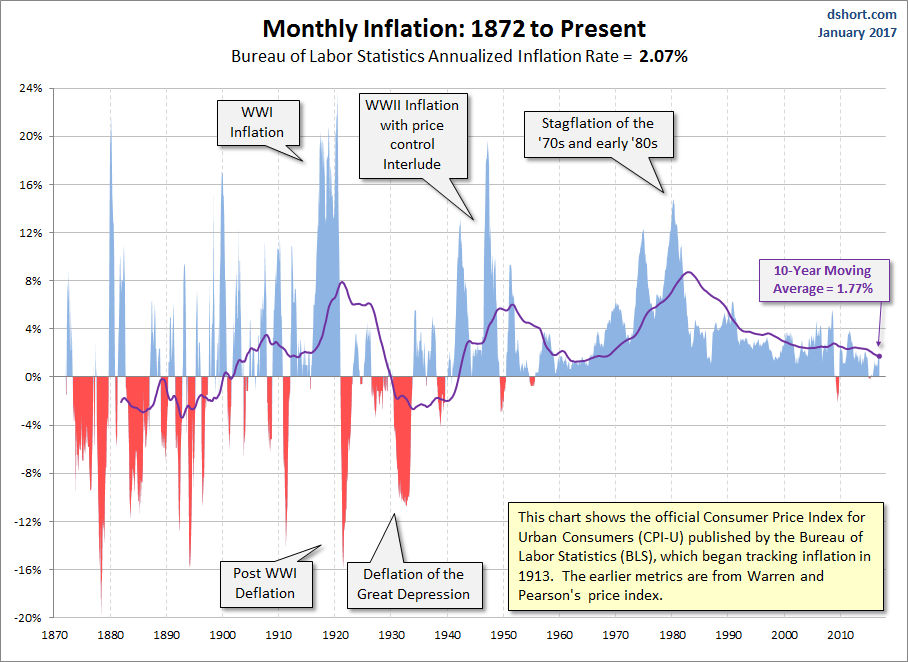
The Fed tightening prior to and after the 1980 election was in reaction to the very high inflation which had pushed the yield on the 10 year T-Note to 15%. In another very interesting chart from dhsort excellent site is this monthly inflation chart from 1872 to the present. The peaks after WWII and in 1980 do stand out as does the trend of low inflation than has been in place for many years.
Gold prices topped out in January of 1980 as the bubble burst after prices hit a high $873 and by Election Day it had already dropped $200 from its high. The close this January is likely to give us more insight as to whether gold has bottomed.
The Economy
It was another week of positive economic news as the year to year CPI to 2.1%. Crude oil prices were up for the fourth month in a row. Industrial Production was better than expected at 0.8% while the Housing Market Index which helped identify the bottom in the housing market over four years ago.
Last Thursday's Housing Starts and the Philadelphia Fed Business Survey were also very strong which is consistent with an economy that continues to get better. As I noted last week the Philly Fed Survey has been in a strong uptrend.
This week we have the flash PMI Manufacturing and Existing Homes Sales on Tuesday followed on Thursday by the Chicago Fed National Activity Index, flash PMI Services and New Home Sales. On Friday we have Durable goods, the advance reading for 4th quarter GDP and Consumer Sentiment.
In the second half of the Week Ahead I discuss the markets including the A/D analysis that indicates the intermediate term trend is positive with no signs of a major top. I will also be covering the Spyder Trust (SPY), PowerShares QQQ Trust (QQQ), the iShares Russell 2000 (IWM) and more.
Interest Rates & Commodities
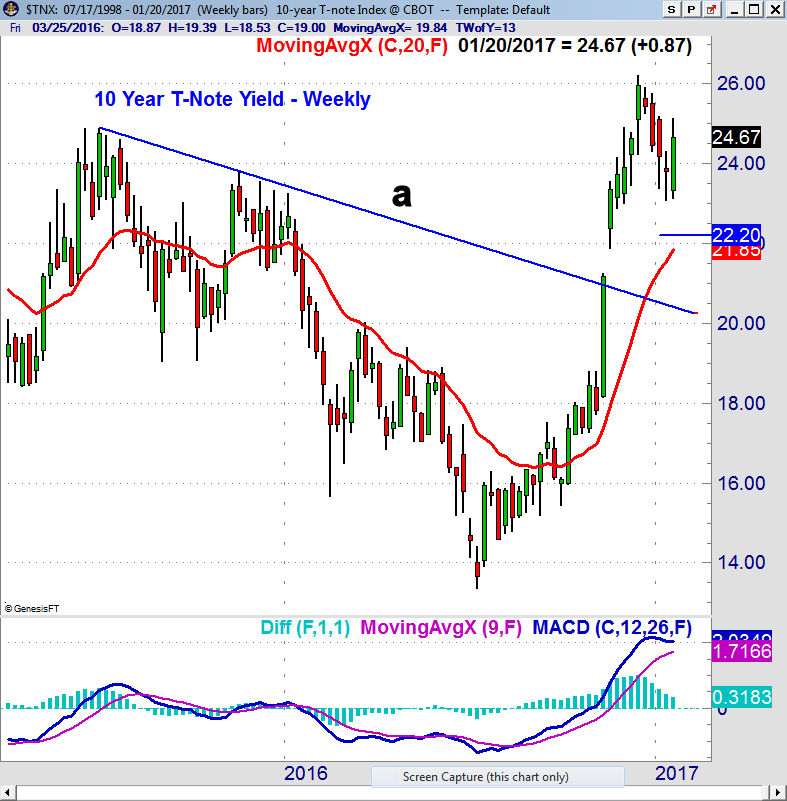
The yield on the 10 Year T-Note rose 0.87% last week after yields had declined for a month. There is more important support for yields at 2.20% (the yearly pivot) and the 20-week EMA at 2.185. The decline in yields has been part of the reason that bank stocks have been moving sideways for the past month.
The weekly MACD is still clearly positive and shows no signs yet of a top. The close last week above the prior week's doji high has triggered a weekly buy signal.
Crude oil prices were barely higher last week but did hold above the prior week's lows. The weekly OBV is still positive but a strong close now above the $54.32 is needed to turn the daily analysis positive. This would signal that the overall uptrend has resumed.
Gold prices have rallied sharply but while the weekly OBV on the SPDR Gold Trust (GLD) has not turned positive it does look stronger on the VanEck Vectors Gold Miners (GDX). A pullback in GDX therefore may create a good buying opportunity.
Market Wrap
A majority of major averages, except the Dow Transport and Utilities, did close the week lower. The small cap Russell 2000 was hit the hardest as it was down 1.47% while the S&P 500 lost just 0.15%. The declining stocks led the advancers last week with 1868 down and just 1222 up.
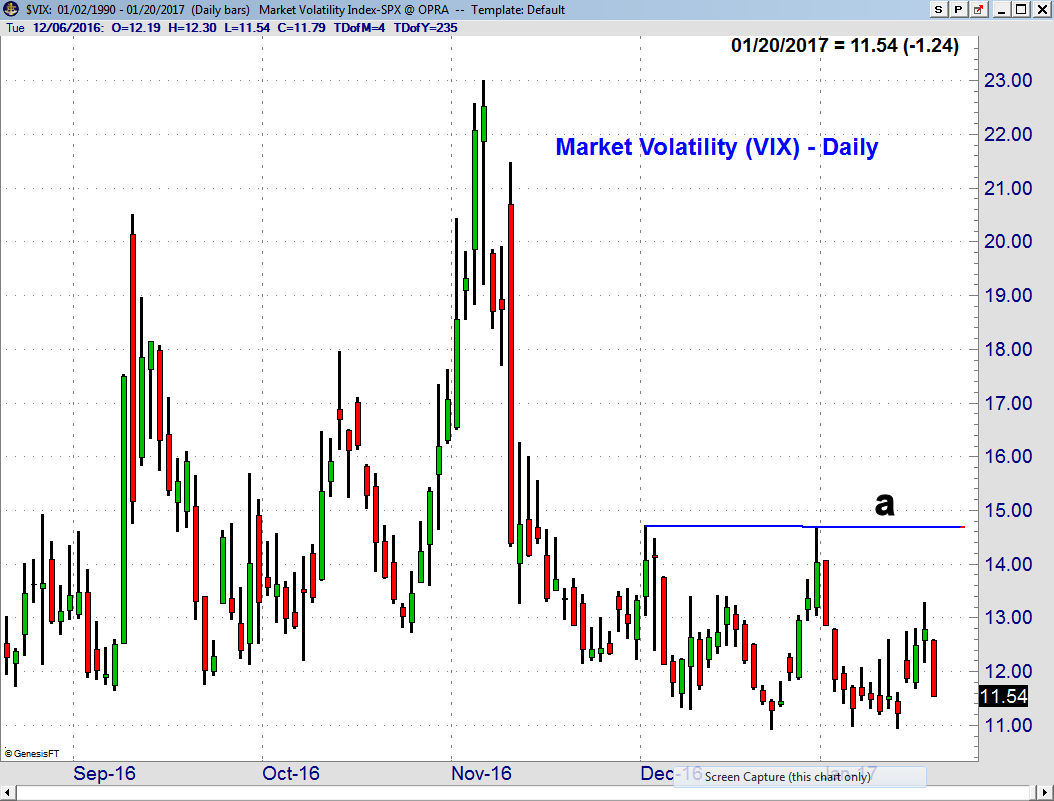
The bullish sentiment according to AAII dropped 6.6% last week to 37% while the bearish % rose 5.7%. This is a positive sign for the market. The VIX declined sharply last week as maybe the recent put buyers that have been publicized in the press are now getting nervous. The VIX has short-term resistance not at 13.28 but a close above 15, line a, is needed to complete a short-term bottom. This would be consistent with a further correction.
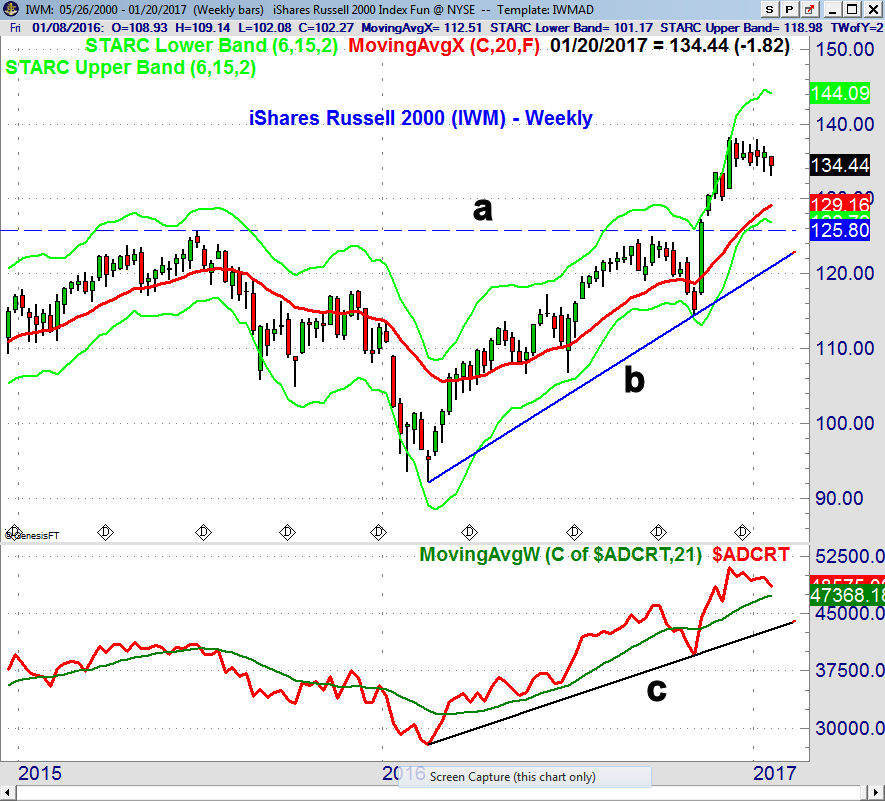
The iShares Russell 2000 (IWM) made lower lows last week but it held just above the $133 level. The quarterly pivot and stronger support is at $129.52 with the clearly rising 20-week EMA at $129.16. The major breakout level and very important support is in the $125.80 area, line a.
The weekly Russell 2000 A/D line confirmed the early December high but has since been correcting. It is well above its WMA and the major support at line c. The daily A/D line (not shown) is still below its WMA and is in a short-term downtrend. This does allow for a further correction.
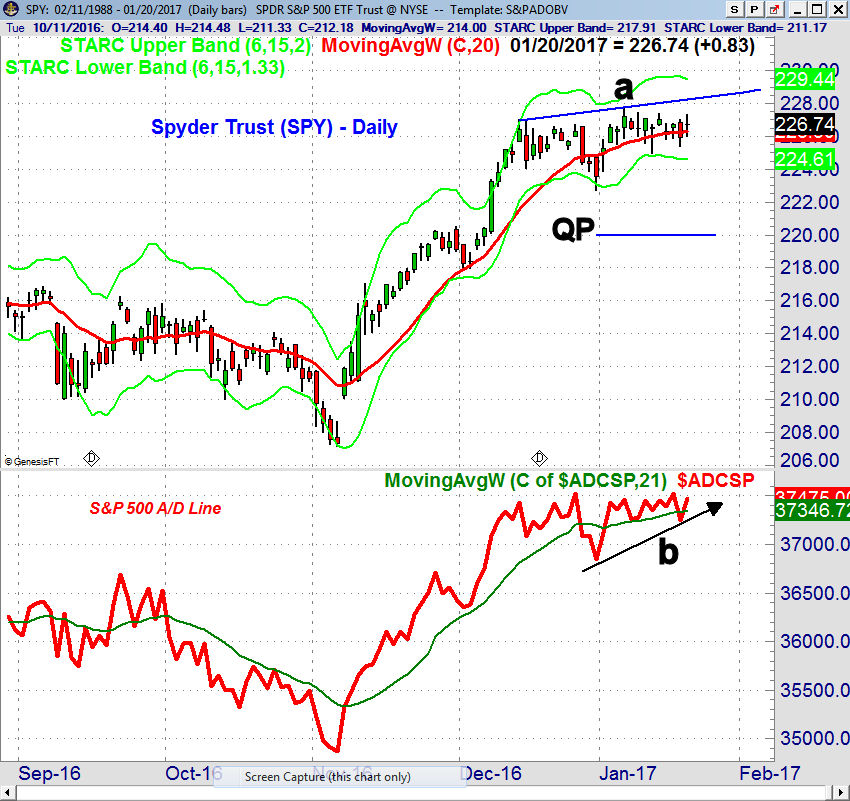
The Spyder Trust SPY) was higher Friday but still lower for the week as it held above the prior week's low at $224.96. There is more important support at the late December low of $222.73 with the quarterly pivot at $220.08. Initial resistance stands at $227.40-$227.75 with the daily starc+ band at $229.44.
The daily S&P 500 A/D moved back above its WMA on Friday and unlike the Russell A/D line is now in a short term uptrend, line b. The weekly A/D line is holding near the all time highs and its WMA is still rising strongly.
The analysis of the Nasdaq 100 A/D line continues to look the strongest as does the price action of the PowerShares QQQ Trust (QQQ). The Dow A/D line looks similar to that of the Russell 2000 A/D line which adds to the split short-term outlook.
What to do? The analysis of the stock market in the Reagan years should prepares investors for the reality of wide swings over the next four years. This does not mean that there will not be gains with the new administration.
The intermediate term analysis of the stock market is still clearly positive so the only question is whether we will see a sharper correction before the market moves higher. The improvement in the economy is also a positive for the 1st quarter. A strong earnings season would help convince investors to buy stocks.
Despite the near term weakness I still would look for the small cap stocks to outperform over the next few months. I higher close this week with positive A/D numbers will indicate the Trump rally has resumed.
My technical review of the transportation stocks last week indicated that it is bottoming and could again lead the market higher. Viper Hot Stock traders took good profits on CSX and another long trade, Checkpoint (CHKP) was up 7% last week.
If there is a deeper correction it should be another good buying opportunity for investors. There are signs that the health care and the biotech stocks may again lead the market higher as their quarterly pivot analysis is positive.
If you would like specific buy and sell advice you might consider my Viper ETF Report or the Viper Hot Stocks Report . Both include regular Trading Lessons and are $34.95 each per month.
Comments
comments