

The stock market's bullish reaction to the FOMC rate hike did not last long as after last Wednesday's strong close the sellers again took over. A week ago I was not convinced that the market would able to recoup the prior week's losses and was looking for rally failure but not a market plunge.
As I noted in Thursday "Can Stocks Now Pass The Test?" one positive from the market's recent decline has been the drop in bullish sentiment. As I said the "AAII survey reveals that the bullish% dropped 4.6% to 23.9%. This is the lowest reading since it hit 21.1% on July 30th. This was supported by a 9.5% rise in the bearish % to 39.4%."
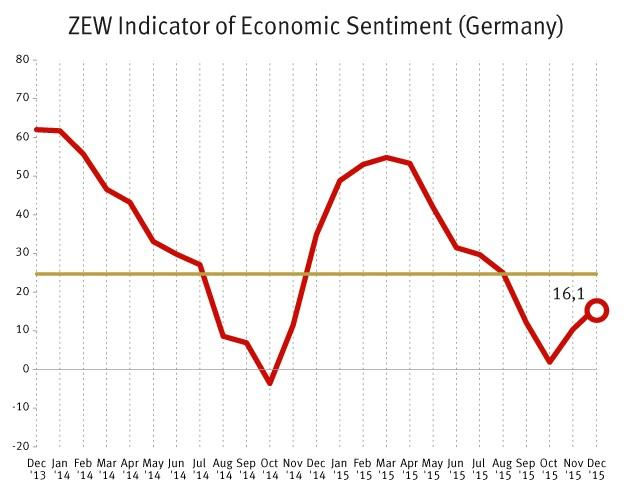
The additional selling on Thursday and Friday is not likely to turn more investors bullish for this Thursday's survey. German investors appear to feel different about the market as the recent survey from ZEW Economic Institute rose to 16.1 from 10.4 the previous month. The chart does suggest it has bottomed. The survey of analysts and institutional investors shows that "confidence is growing that the German economy is sufficiently robust to meet these challenges in the coming year," said ZEW president Clemens Fuest.
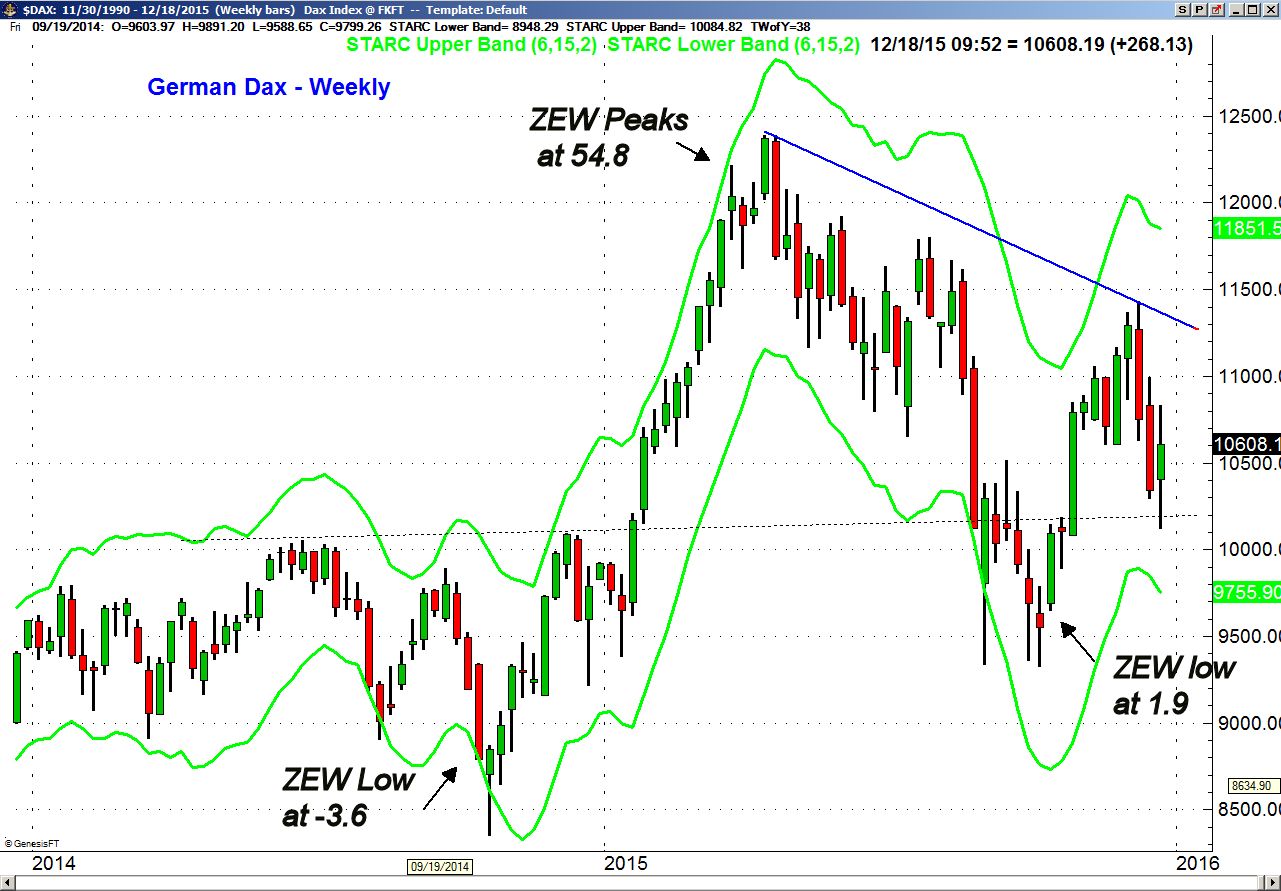
The weekly chart of the German Dax Index shows that they have had a good record recently. At the October 2014 lows when most of the world was negative on stocks the sentiment index bottomed at -1.6. The Dax was the stellar performer in early 2015 as the ZEW sentiment peaked in March at 54.8 just a few weeks before the high.
For the next 25 weeks the Dax dropped sharply reaching its low in October of 1.9 as the US market had bottomed early in the month. Clearly over the next few months I will be watching this indicator closely. Some of the economic data looks more promising for the Euro zone markets than it does for the US.

The Euro zone PMI Employment Index from Markit has just broken its downtrend (line a) . This confirms the strong uptrend from the 2009 and 2013 lows, line b. The data on manufacturing in Italy showed the strongest growth in the past four months while the German Manufacturing PMI is also expanding. The Eurozone PMI is still in its uptrend from the 2013 lows.
The Economy
The economic focus last week was on the FOMC and the only real bright spot for the economy was the Leading Indicators last Thursday as it rose 0.4% above the consensus estimate of 0.2%. Strong Housing Permits gave it a boost as did low short term rates. It was held back by the weakness in the manufacturing sector and last week's regional surveys did not help.
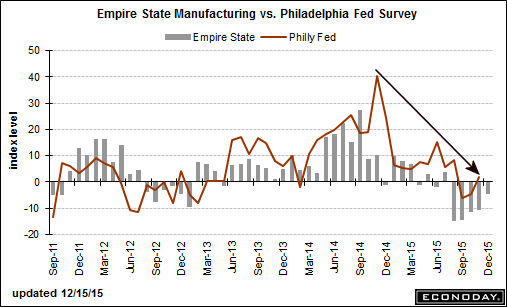
The Empire State Manufacturing Survey declined for the 5th month in a row. The Philadelphia Fed Manufacturing Index rose last month but turned down in December dropping to -5.9. Industrial production was also weak last Wednesday.
Also on Wednesday the PMI Manufacturing Index Flash came in at 51.3 which was the lowest reading in the past three years. Then on Friday the Kansas City Fed Manufacturing Index came it at -8.
In the housing market the data was better as the Housing Market Index came in at 61 consistent with strong but slowing activity as it was a bit lower than the past two months. The Housing Permits rose 11% as multi-family permits were up 27%. More good news from homes under construction which are showing a 18.3% gain on a year to year basis.
This did not help the home builders Friday as Toll Brothers (TOL) was down over 2% while Pulte Group (PHM) lost 1.6%. Both were negative basis my weekly analysis on December 11th so this was not surprising. If you are a stock or option trader you may find my weekly scans of the Nasdaq 100 and IDB Top 50 stocks helpful in your trading.
In last week's article Time To Short High Flyers Like AMZN or NFLX? my analysis favored bearish option strategies in Amazon.com (AMZN) on a rally from the prior week's close of $640 to the $672-$680 area. It hit a high of $682 early Thursday (stops above 685 were recommended) as it dropped below $665 on Friday.
This week we start out with the Chicago Fed National Activity Index followed by the 3rd quarter's final GDP and Existing Home Sales on Tuesday. Durable Goods are out on Wednesday along with New Home Sales and Consumer Sentiment.
Interest Rates & Commodities
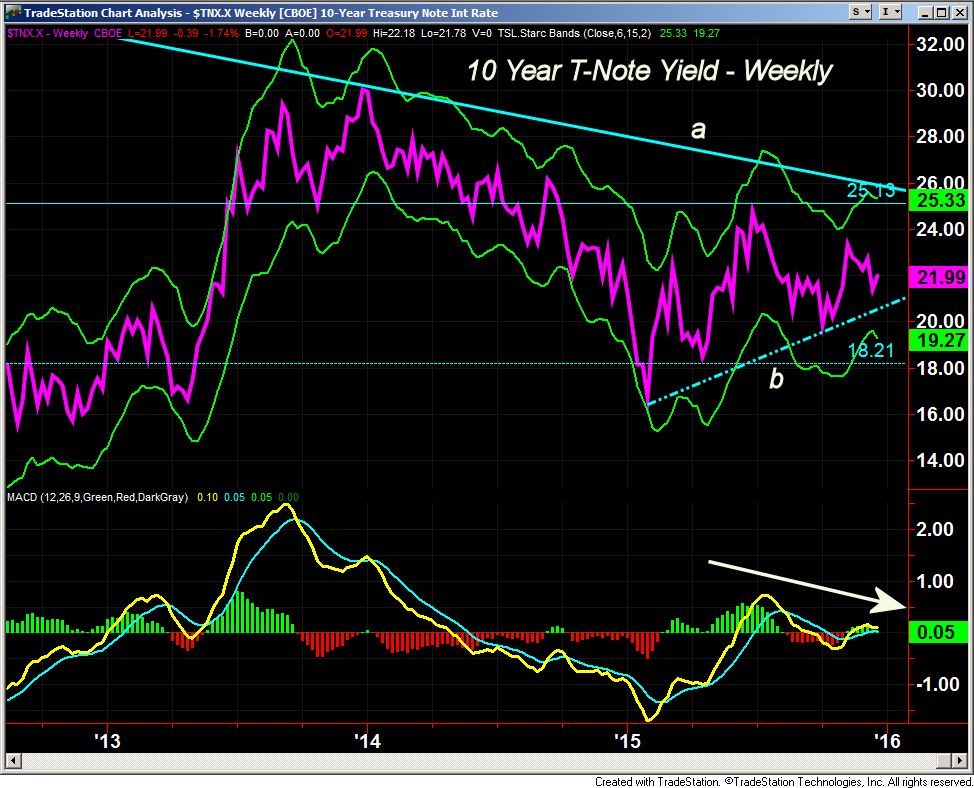
The yield on the 10-Year T-Note rose slightly last week but is still below the key resistance in the 2.51-2.60% area, line a. The weekly uptrend is now at 2.06% with further support just below 2.00% A drop below the more important at 1.82% would signal much lower yields. The weekly MACD has turned lower and could give a sell signal in the next few weeks.
It was another wild week for crude oil as the March contract lost another $1.36 per barrel. The lower weekly trend line support, line a, has been reached but there are no signs of a bottom from the weekly OBV.
The Spyder Gold Trust (GLD) was hit hard on Thursday and closed the week lower. The weekly OBV has made a further new low while the gold miners are acting much better. A good rally is needed in the miners over the next week or so to support my bullish case.
Market Wrap
Many commentators expressed optimism in their post FOMC analysis as they concluded the market's reaction was a sign that the Fed rate hike had come off just as planned. Therefore the heavy selling Thursday and Friday has caught many by surprise.
Though the positive sentiment of German investors is likely a plus as we head into 2016 that does not mean that investors will not have a bumping ride as we head into 2016. I expect the bearish market commentary to increase as we head into the end of the year. Investors are likely to become even less bullish in the next few weeks which will be a positive for stocks.
Over the past 65 years the S&P 500 has closed higher in December 49 times with an average gain of 1.59%. The S&P is currently down 3.6% for the month which at this point makes it the worst December since the 6% decline in 2002. The S&P needs to close back above 2080 to put it back in positive territory for the month.
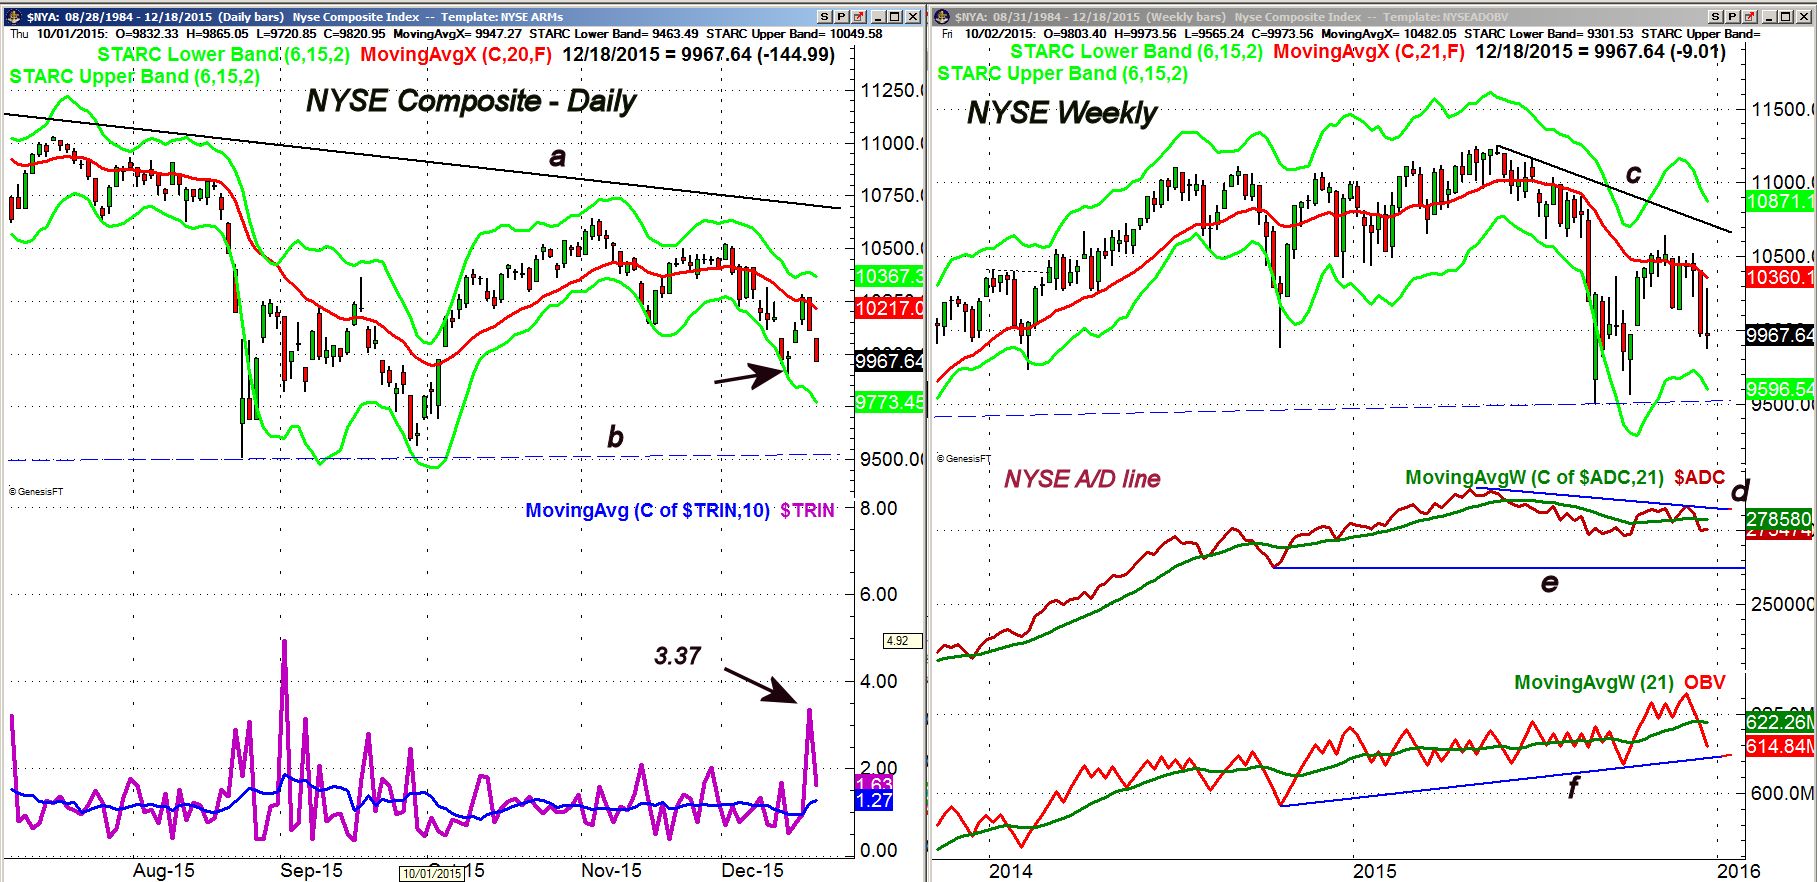
The relatively high 3.37 reading in the ARMS Index as of Thursday's close was a sign that market was getting sold out so we could see a rally by Christmas. This indicator was created by world renowned technician and old friend Dick Arms Dick. He wrote The Arms Index (Trin Index): An Introduction to Volume Analysis, as well as many other excellent books on technical analysis.
I shared my analysis of his excellent technical tool last year in "Profiting from Panic Selling" and Thursday's reading that those on the short side should not be greedy. It will sometimes peaks as the market bottoms but sometimes the extreme oversold reading will come a week or two before a market bottom.
The NYSE's drop to the daily starc- band on Monday suggested it was not a time to sell but the rally Wednesday failed right where it should have at the declining 20 day EMA. The starc- band is now at 9773 which is a potential downside target this week. There is long term support on both the weekly and daily charts in the 9500 area.
The wide range on the weekly chart allows for more volatility in the week ahead . There is major resistance now in the 10,200-10,600 area. The weekly A/D line is back below its WMA but both the daily/weekly are still above the recent lows. There is major A/D line support at line e. The weekly OBV is below its WMA after a new high just three weeks ago. The McClellan oscillator closed at -107 and is well above the Monday low of -294. Therefore a bullish divergence could form on a drop below last Monday's lows.

The 0.3% drop in the Spyder Trust (SPY) last week does not tell the real story as the ranges were wide. The weekly starc- band is at $196.04 with the quarterly pivot at $195.06. There is even stronger support now in the $193 area, line a.
The weekly A/D line is below its WMA but still well above the major support at line b. The daily A/D line (not shown) did make a new low on Friday keeping the short term downtrend intact. The weekly OBV is still above its WMA and the long term support at line c.
As I noted last week the PowerShares QQQ (QQQ) still shows the best daily relative performance analysis (see chart) . The weekly RS analysis for the QQQ and the Technology Sector Select (XLK) still indicates they are market leaders. Once the current decline is over these two ETFs are likely to do the best. I will be sending a full ETF sector report out to existing and new Viper ETF clients before the opening Monday.
What to do?
There is no way to sugar coat it as the bears are in charge after last week's action. As I said last week " I would expect the current turmoil to continue for a couple of more weeks as it will take time or a very powerful stock market rebound to reverse the recent technical damage".
That said the potential for some short term bullish divergences to be formed next week should not be ignored though any rally would have to be very strong.
If you take the view that some of last week's decline was a result of tax-loss selling it should be over this week. The wide swings recently have only favored short term traders as the volatility has made even swing trading difficult.
There are some interesting developments in the overseas markets and the emerging markets, as of last week's close, appear to be in the process of forming double bottoms. Even though the FOMC rate hike has some analysts even more concerned about these markets they could be the surprise winner of 2016.
Those who are just getting into stocks through dollar cost averaging positions in globally diversified or S&P tracking ETFs or low cost mutual fund I still believe will be pleasantly surprised in 2016.
Traders will have to continue to be nimble and avoid being greedy. As we get closer to the holidays taking some time off might not be a bad idea as you don't want to sour your holiday spirit with a losing trade.
Because of the Friday Christmas and New Years the next Week Ahead column will be released on January 8th. I will still be watching the markets over the holidays and you can follow my comments on Twitter and StockTwits.
My best wishes to all of you and your families for the holidays. My thanks for your continued support. Tom
Comments
comments