

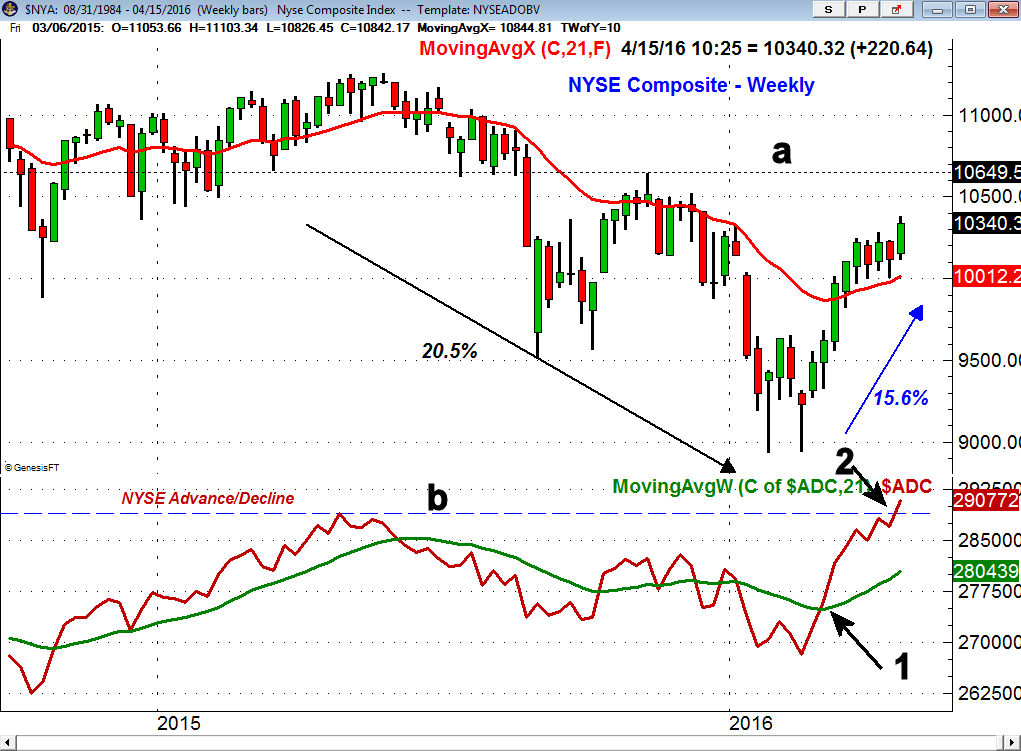
Stocks continued to surprise the majority last week as the market gains were quite impressive. As I pointed out last week the S&P 500 A/D line moved above the May 2015 highs. The weekly NYSE Advance/Decline has also now moved above its 2015 high, line b. The A/D line is also accelerating to the upside which is bullish for the intermediate term. This implies an eventual move in the NYSE Composite above the May 2015 high which means a potential 8% increase from Friday's close. What could cause such a rally?
The early earnings results have been beating the overly negative Wall Street estimates as while the revenue for Alcoa Inc. (AA) was down 15% and earnings missed the stock was up 6.8% for the week. The earnings from JPMorgan Chase (JPM) were much stronger than expected and the stock soared. The 18% slide in the quarterly profits of Bank of America (BAC) could not keep the stock down as it closed up 8.7%.
The experts are still looking for a 8.5% drop in quarterly earnings so it will be important that the results over the next few weeks continue to beat the street. The individual investor, according to AAII's latest survey, is not convinced about better earnings as the AAII bullish% dropped 4.3% to 27.8%. The bearish% increased 3.4% to 24.9% while the very high neutral camp was unchanged but this is expected to change in the coming weeks.
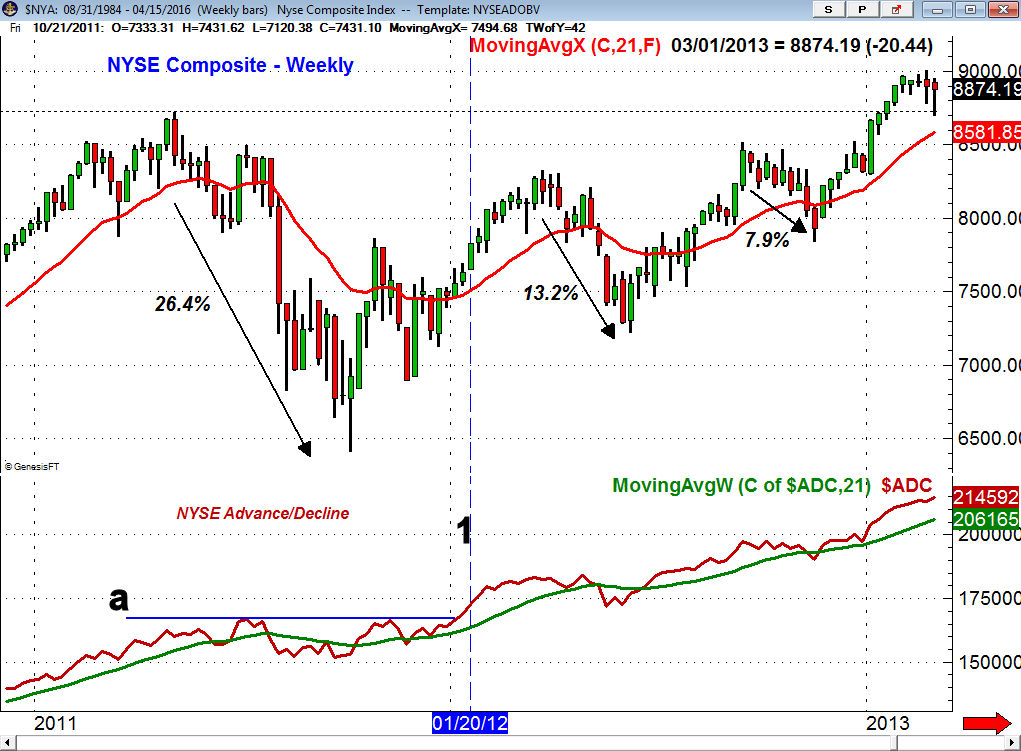
In 2011 the NYSE Composite peaked in May at 8718 and by October had dropped 26.4% from the high. The weekly NYSE A/D line held up much better than prices unlike what occurred in the A/D line since the May 2015 high. Still it was not until January 20, 2012 (line 1), over three months after the 2011 low, that the NYSE A/D line was able to move to a new high as the resistance at line a was overcome.
In 2012 the NYSE continued to move higher for another nine weeks and gained 6% before it started to correct. Subsequently the NYSE Composite dropped 13.2% in eleven weeks. The correction did hold above the 61.8% Fibonacci support before it again turned higher. By September 12, 2012 the NYSE had rallied 17.9% from the June lows. This was followed by a 7.9% correction and the NYSE Composite did not exceed the 2011 high until early 2013.
The correction in 2011 was more severe in terms of price than the drop in early 2016 but the speed of the decline this year likely caused greater levels of investor fear. Despite the strength of the recent rally the market's action in 2011 does allow for the market to rally even more before there is a significant correction. Such a rally could take the NYSE Composite back to the 2015 highs. This should finally reduce the bearish sentiment.
This would likely be followed by a market correction as the high degree of bullish sentiment would make the market increasingly vulnerable. The 20.5% decline in the NYSE from the May 2015 high to the February 2016 low can be broken into two parts. The first was a 15.5% drop from May to the August low and then a second decline of 14.3% from the November high to the February 2016 low.
For most investors these two declines have made them very fearful about investing in the stock market while others are having trouble deciding how much to invest. With the NYSE Composite now higher for the year it is now a good time to review your strategy.
Though it was a tough call on January 16th "Is Bullishness Low Enough Now? " I did not think then that we had started a new bear market and do not believe we will see one this year. It is clearly possible that we will see one or more 8-10% corrections before the year is over. That is what investors should focus on when determining their portfolio allocation.
Assuming a very conservative $100,000 account with 30% in stocks and 70% in bonds a 10% decline could mean a loss of $3000 or 3% of your portfolio (This assumes flat action in the bond portion of your portfolio) However a 50% allocation to stocks could translate into a $5000 or 5% loss. If you are not close to retirement then I would suggest a 70% allocation to stocks.
This might mean you would have to endure a drop of $7000 or 7% in your portfolio or if we had a decline like January's it could mean a draw down of $14,000 or 14%. Therefore you have to ask yourself if that were to happen to you would it keep you up at night or make you sell when if Dow opened down 500 points?
If the answer is yes or if you are not sure then it maybe it is a sign that a smaller allocation to stocks might better fit your personality. Clearly if you are 40 or younger I would advocate 70-80% in stocks if you can weather any corrections. For the long term health of your portfolio one must avoid reacting emotionally to the markets.
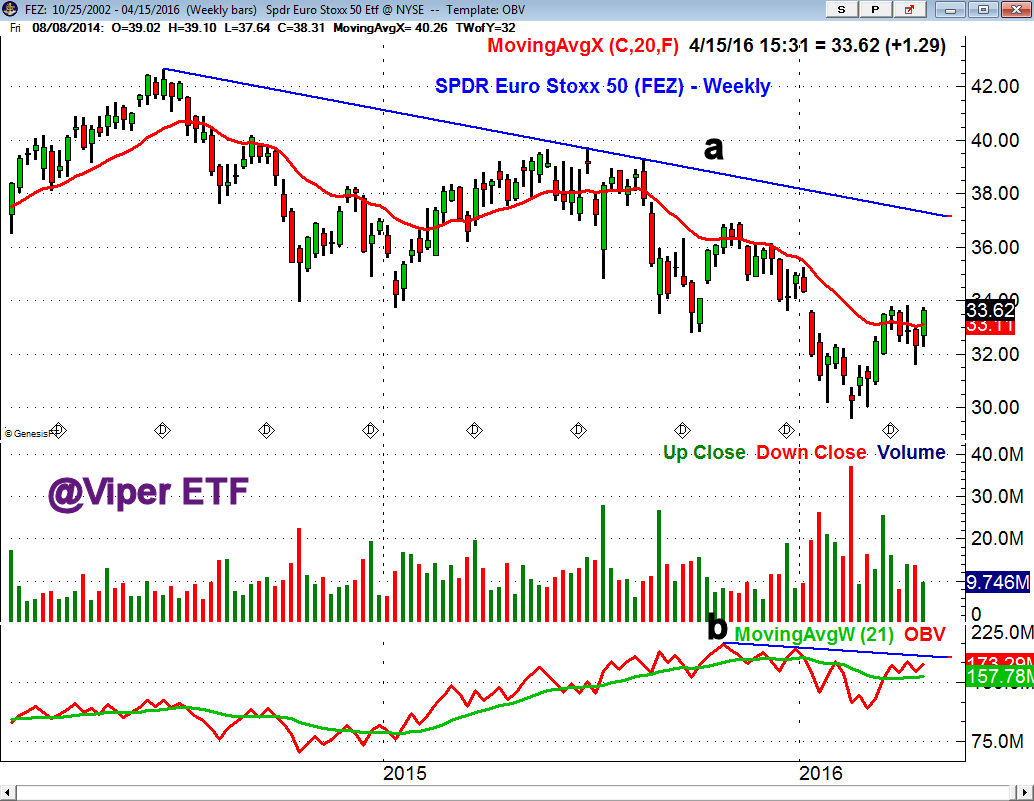
The upside reversal last week in the Euro zone markets is an encouraging sign as it is evident in the weekly chart of the SPDR Euro Stoxx 50 (FEZ) . A strong close above the $34 area would support the view that it has bottomed. The weekly OBV is holding above its WMA and a move through the resistance at line b, will signal upward acceleration. I will be discussing a strategy for FEZ in Monday's Viper ETF Report.
The German Dax needs to surpass the 10,200 area to indicate it is ready to test the longer term downtrend in the 10,800 area. Though I pretty much dismissed most of the concerns on the "wall of worry" at the end of February the lagging action of the Euro zone markets at the time was a concern.
The Economy
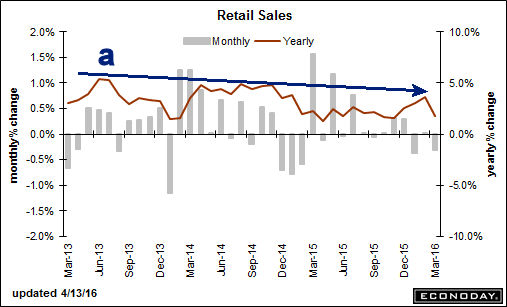
The latest reading on Retail Sales showed a 0.3% decline as auto sales continue to stall as they have not recorded a gain since last November. On a year to year basis there has only been a 1.7% gain as sales have failed to breakout above resistance, line a. The sales data from restaurants, apparel and department stores were all lower.
The Producer Price Index and Consumer Price Index were both lower than the consensus estimates which was disappointing. The Empire State Manufacturing Survey last Friday came in at an impressive 9.56 well above the consensus estimate of 3.0. This reading is consistent with the recent signs of expansion. The six month data suggests further improvement due to the weaker dollar. This data is consistent with the recent improvement seen in the Philadelphia Fed Survey.
Also on Friday the Industrial Production came in at -0.6% for the 2nd month in a row. It did not show the improvement that some were hoping for and the mid-month reading on Consumer Sentiment was down to 89.7 from last month's reading of 91.0.
On Monday we get the Housing Market Index followed on Tuesday by Housing Starts along with Existing Home Sales on Wednesday. In addition to the jobless claims Thursday we also have the Philadelphia Fed Business Outlook Survey. There is more new data on manufacturing Friday as we get the flash reading on the PMI Manufacturing Index.
Interest Rates & Commodities
The yield on the 10 Year T-Note was a bit higher last week but is still locked in a short term range. A weekly close above the 2.00% area is needed to signal a rally back to the 2.20% area but the weekly technical studies still favor lower yields.
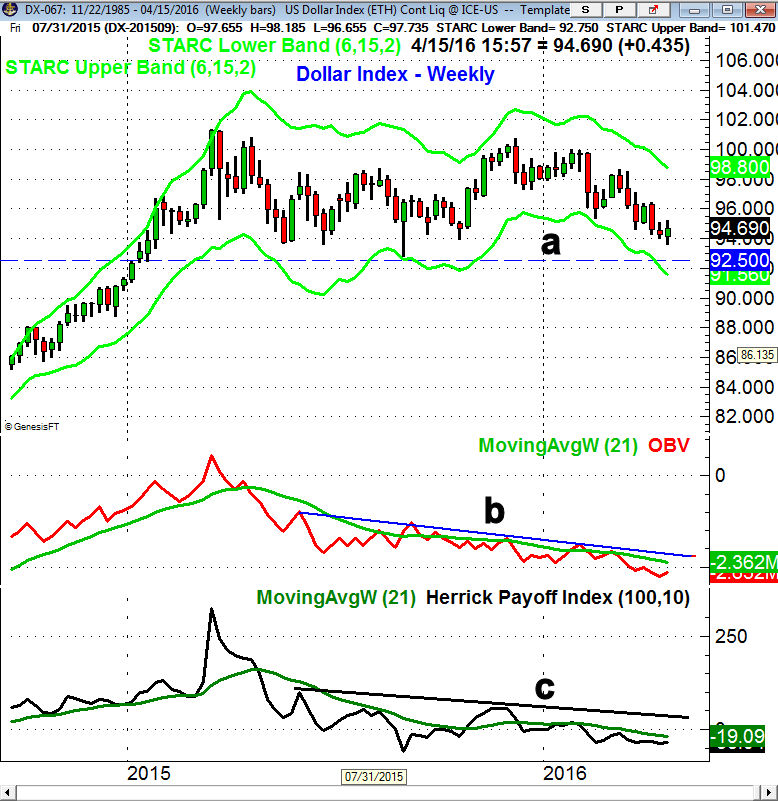
The dollar index was a bit higher last week but it still looks ready to test my longer term target from February in the $92.50 area. The weekly OBV is still in a downtrend, line b, and is well below its WMA. The HPI still indicates negative money flow and is well below the major downtrend, line c.
Crude oil pulled back late in the week as traders were looking ahead to the weekend energy meeting. It still closed the week higher and though we may see a further pullback over the short term the weekly analysis looks strong.
Gold futures were lower last week and the overall action still suggests the decline is not over yet. The gold miners do look better technically and we may get a short term entry point next week.
Market Wrap
The Dow Industrials were up 1.8% for the week just a bit better than the 1.6% gain in the S&P 500. Both lagged well behind the 3+% gains in the Dow Transports and small cap Russell 2000. It was another strong week for the A/D line as 2503 stocks were higher with just 664 stocks closing lower.
Even though the 3.8% gain in the financial stocks got most of the press, material stocks also rose 3.7% as these two sectors did much better than the third place gain of 2% in the oil & gas stocks.
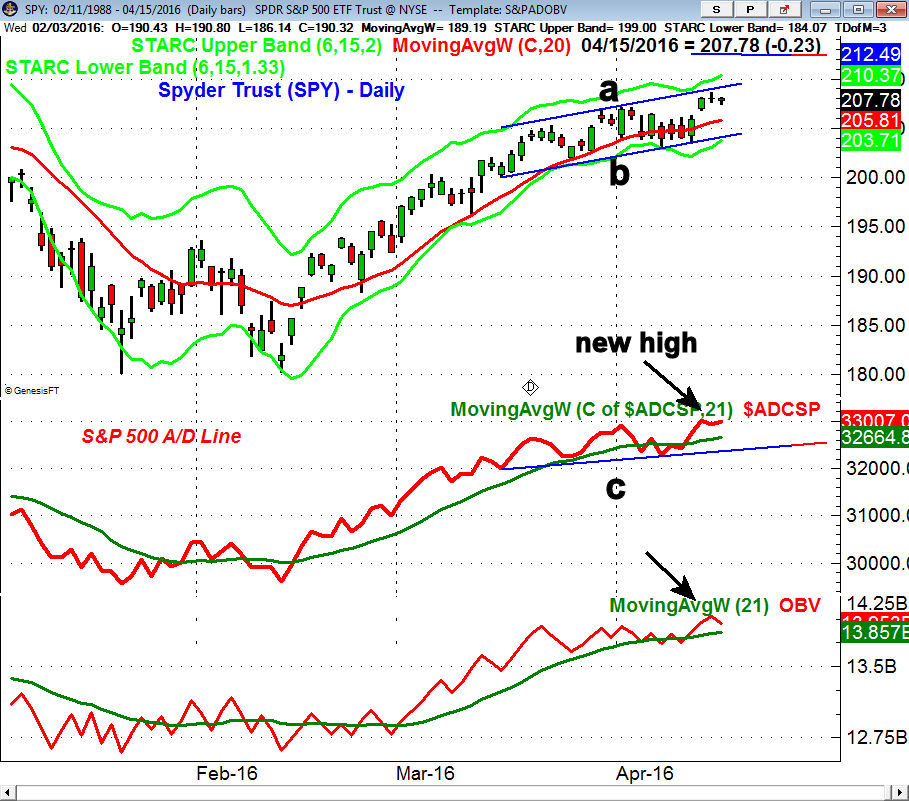
The Spyder Trust (SPY) is still in its upward sloping trading channel, lines a and b. The close on Friday was still above Thursday's doji low with short term support now at $205.81. There is more important support now in the $203 area. On an upside breakout of the range the SPY should rally to the $210-$212 area.
The S&P 500 A/D line made another new high on Wednesday with the weekly A/D line (not shown) also making another new high. For now it would take a decline below the April 7th low (line c) to weaken the trend in the A/D line. Also there was a new high in the OBV which continues to hold above its WMA.
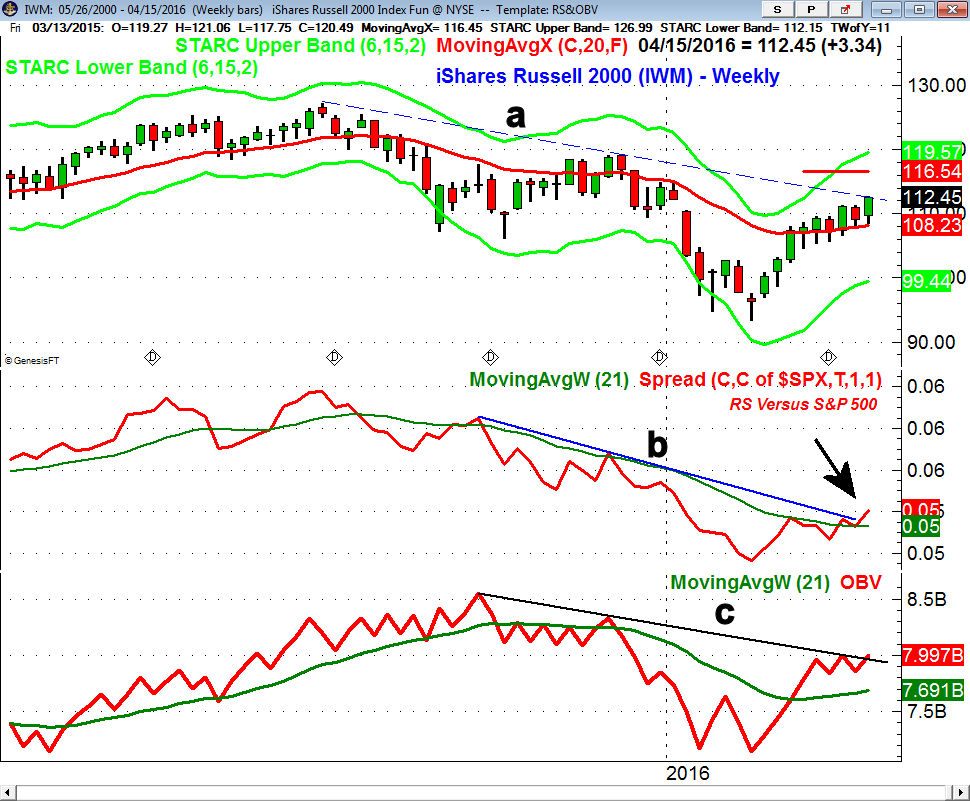
The ability of the small cap iShares Russell 2000 (IWM) to outperform the large cap stocks is a positive sign as these more speculative issues may help to push the overall market even higher. The weekly chart of IWM shows that it is now testing the weekly downtrend, line a. Once again the 20 week EMA at $108.23 did support prices. There is next strong resistance in the $115-$116.50 area which includes the monthly pivot resistance.
The weekly relative performance now appears to have completed a bottom as it turned up from its WMA and has broken the downtrend, line b. This confirms the positive action of the daily RS line. The weekly OBV has been above its WMA since early March and closed Friday just barely above its downtrend, line c.
The PowerShares QQQ Trust (QQQ) had solid gains last week but the Nasdaq 100 A/D line has not yet surpassed its all time highs from 2015. The weekly RS analysis is above its WMA but does not indicate that QQQ is a market leader.
What to do?
Even though the major averages posted solid gains last week there are still many who do not trust the stock market rally or the health of the economy. As I argued last week the misguided concerns over a debt bubble or an imminent recession were bullish for the stock market. There were some encouraging signs about the economy last week but it will be important that this trend continues in the next few months.
It is doubtful that the stock market action has encouraged new buying by the still cautious stock market investors. Even though new buyers of an index tracking ETF could still see another 5-8% on the upside they also have a 3-5% downside risk.
Therefore investors and traders should keep paying close attention to the entry levels as well as the risk on all new positions. For those not in the market you can either wait for the inevitable correction that is likely in the next month or two or alternatively start a dollar cost averaging program. My suggestion would be to make six equal dollar purchases every two weeks for the next three months.
The sector rotation continues to create new opportunities in some of the more specialized sector ETFs and there are several I am looking at for next week. For stock traders there are number of stocks that are consolidating and provide some good opportunities once they resume their major up trends.
The ability to read the volume patterns in a stock or ETFs can often make the difference between success and failure. Tom will be teaching a two-part interactive online class at end of April to a very small number of students. For more information - here is the link for the Secrets of Volume course.
Comments
comments