

The stock market has been nervous this week as it has the earnings season, confirmation hearings and president Elect Trump's long awaited press conference to put it on edge. The daily gyrations in the stock market often mask what is taking place internally.
The Spyder Trust (SPY) was unchanged on Tuesday while the Dow Industrials were a bit lower and the NYSE Composite was a bit higher. In contrast on the NYSE there were 1924 stocks advancing and just 1075 declining Tuesday which was a sign of internal strength.
So far in 2017 the Powershares QQQ Trust (QQQ) has gained 3.38% versus just a 1.77% gain in the Spyder Trust (SPY). In 2016 the QQQ came quite close to its yearly pivot levels as the high at $121.52 was close to the initial yearly resistance at $122.06 and the low early in the year at $93.80 was above the year S1 support at $91.28.
In last week's column I also reviewed the yearly projections for the SPDR Dow Industrials and the iShares Russell 2000 (IWM).
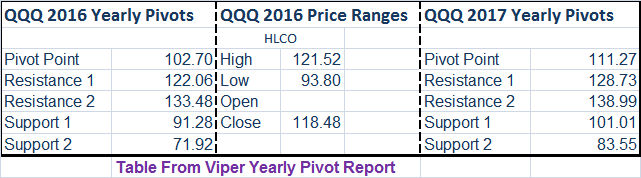
The Yearly Pivot Table shows the actual price ranges as well as the pivot projection for 2016. For 2017 the pivot stands at $111.27 with the initial yearly pivot resistance at $128.73. These will be the key levels to watch and if the QQQ should surpass the R1 resistance then the focus would be on the R2 resistance at $138.99.
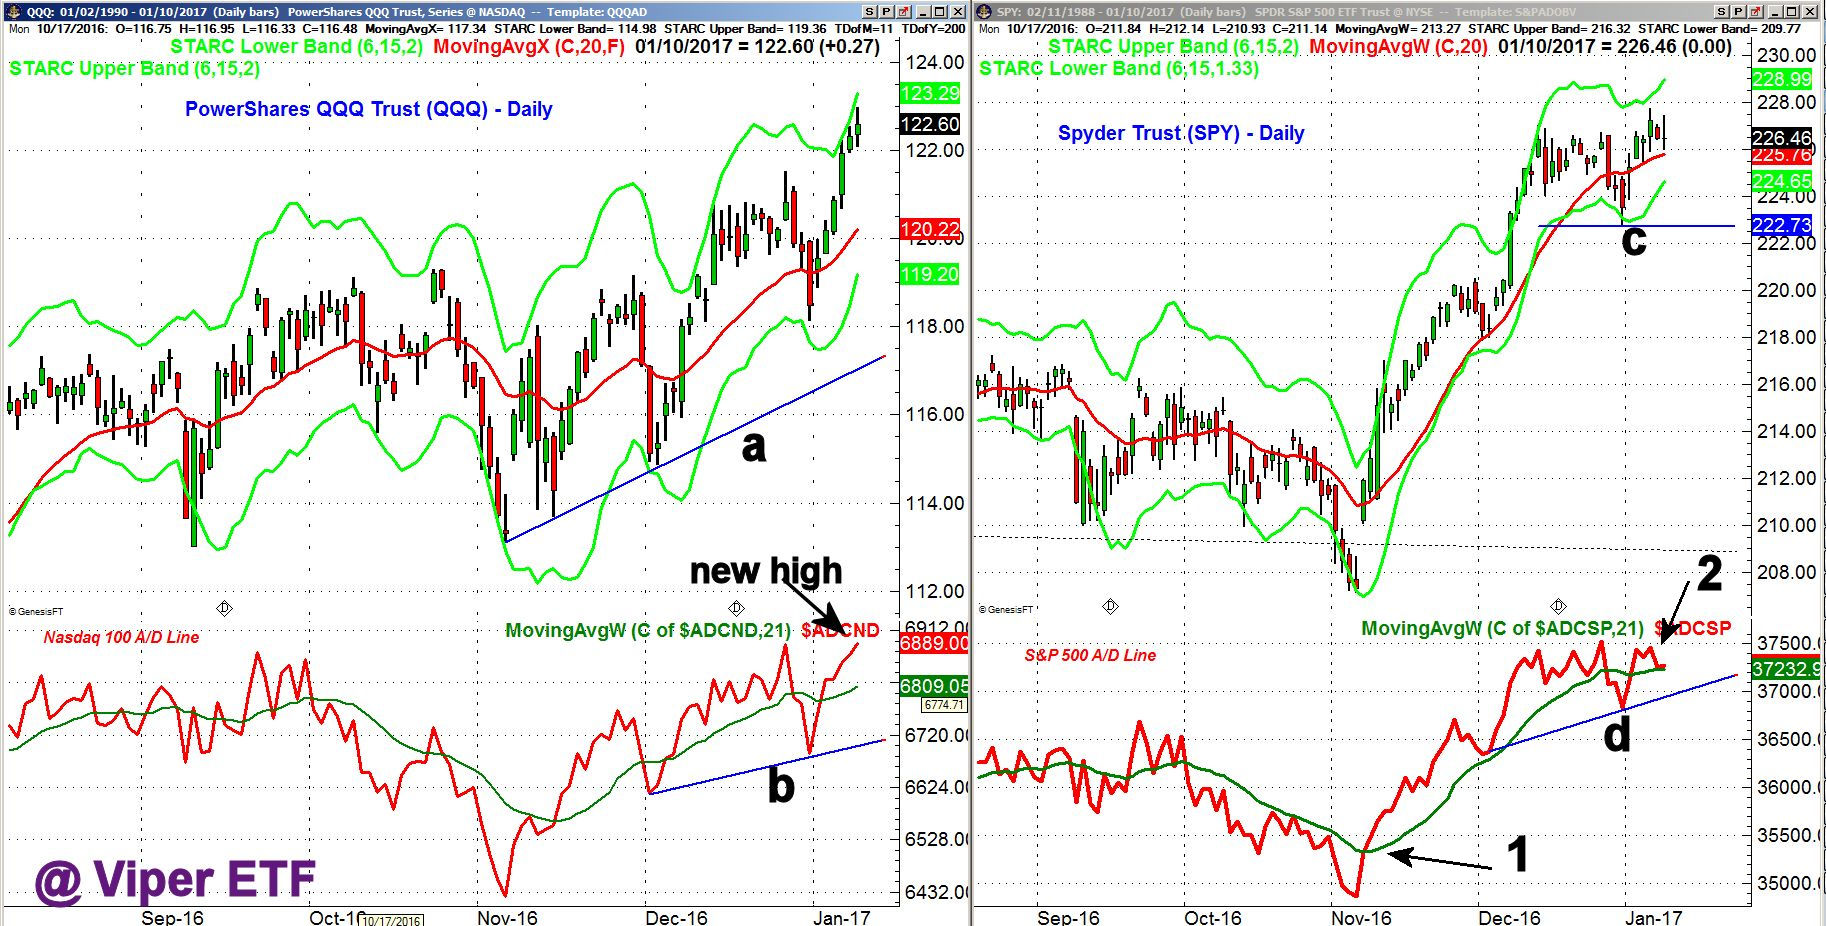
The daily chart of Powershares QQQ Trust (QQQ) shows that it has been testing the daily starc+ band for the past few days as it is well above the strongly rising 20 day EMA at $120.25. The QQQ dropped below its EMA at the end of the year.
- The Nasdaq 100 advance/decline line made a new high on Tuesday as it slighly surpassed the December high.
- The A/D line is above the rising WMA with more important support now at line b.
- There are upside targets for the QQQ in the $125-$126 area.
The Spyder Trust (SPY) formed a doji on Tuesday which is a sign of indecision and is quite close to its 20 day EMA at $225.78. The daily starc- band is at $224.65 with more important support at $222.73, line c.
- The S&P 500 A/D line moved above its WMA on November 8th (point 1) and stayed above it until the latter part of December.
- The S&P 500 A/D line has not yet made a new high in 2017 (point 2) so it has been diverging from the December high.
- A decline in the A/D line below support at line d and the late December low is needed to confirm the divergence.
- A daily close above $228 will signal a move to the $230-$232 area.
What to do? The intermediate term analysis for stocks is still clearly positive as is the daily analysis. A correction back to good chart and retracement support would not be surprising in the next few weeks. The recent positive technical signs on the health care, biotech and transportation sectors indicates they are becoming market leaders.
A Trading Lesson that focuses on the yearly pivot analysis for the key market tracking ETFs and the major sector ETFs will be sent out to new and existing subscribers of both the Viper ETF Report and the Viper Hot Stocks Report at the end of the week.
Comments
comments