
Stocks again tried to rally on Friday but as was the case for the previous eight days the S&P 500 did close lower. Though a few tone deaf or reality challenged folks did not blame the market decline on the prospect of Trump victory the majority of market veterans of both stripes all agreed.
Given that the S&P 500 has not closed lower for nine consecutive days since 1980 some have assumed that stocks will not see a further sharp drop if Trump does win. It is very likely that no matter the outcome the volatility will be high for the next few weeks no matter who wins.
In 1980 the decline started on December 1st and lasted through the 11th as the S&P 500 subsequently rallied 1.4% to break its losing streak. The S&P 500 recorded a loss of 9.4% in nine days but from the 12/11 low it recorded a gain of 11.4% as it rallied through January 6th. By February 20th the S&P 500 had dropped below the lows from December 11th and did not make its bear market low until August 1982.
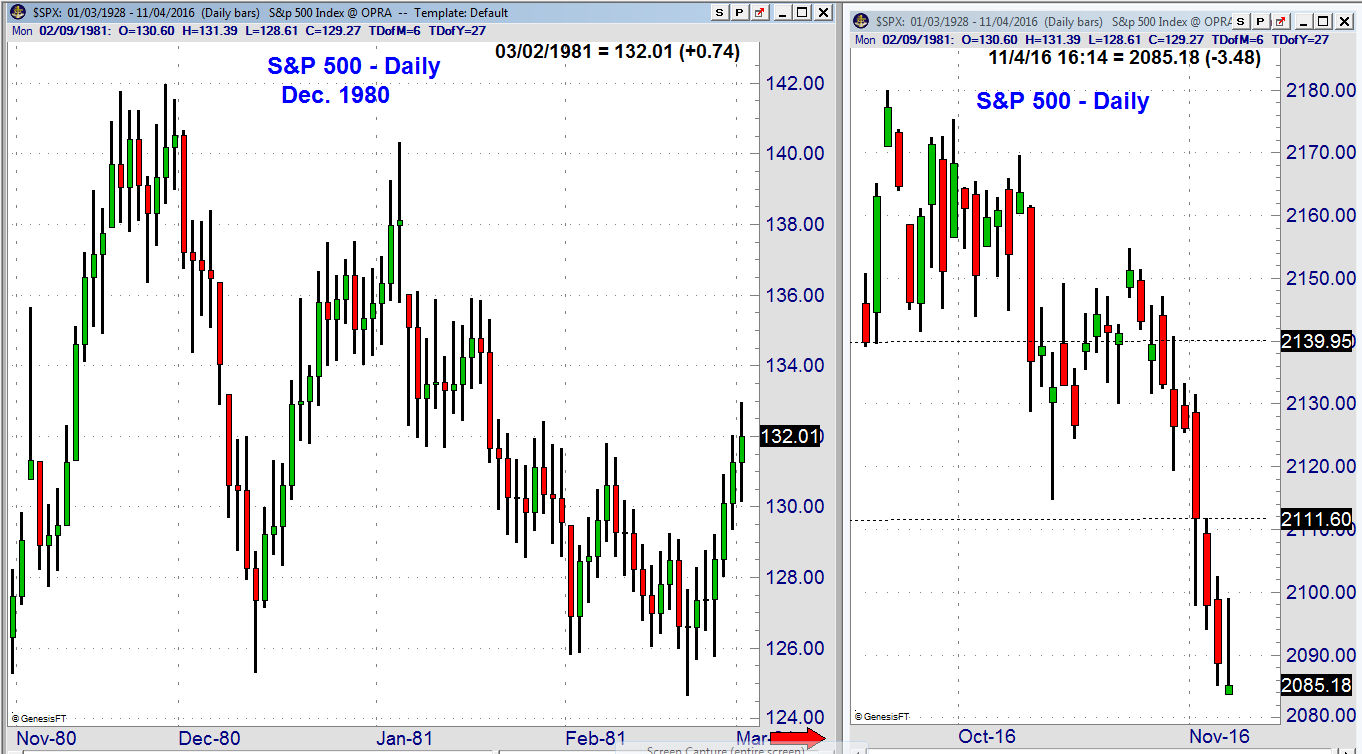
Many things were different then as the NBER determined that a short recession had occurred between January and July of 1980 so stocks were rebounding in late 1980. The economy recovery was short lived as the US moved back into the recessionary mode by July 1981.
In a recent column "Market Insights From Past Election Years" I looked at the stock market behavior during the past three elections. The current charts look the most similar to those of 2012 as the "day after the election the NYSE started dropping as it lost 5.6% in just 8 trading days." From the post election lows however it gained 7.6%.
In comparison the recent decline has been quite mild, just a 3.1% drop so far. Some sectors have done much worse than the S&P 500 but others have done better. In bull and in bear markets risk control is essential but in a market that is facing possible short-term turmoil it is much more difficult.
The risk to one's portfolio is dependent on not only the amount you are willing to risk but also the amount you have invested. If you are willing to risk 10% of a $100,000 portfolio that is 50% invested then your risk is $5000. On the other hand risking 10% on a $100,000 portfolio that is 100% invested means a risk of $10,000.
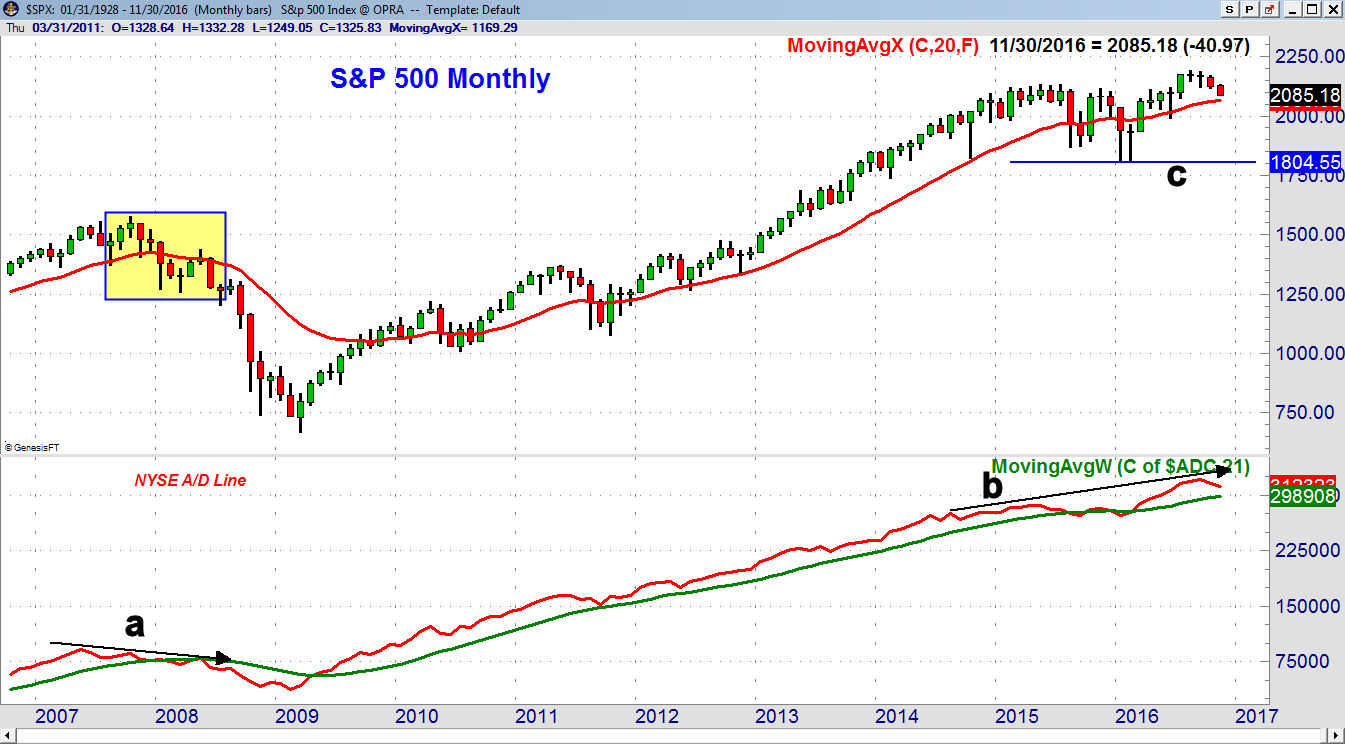
It is important to always acknowledge the worst-case scenario since too many investors focus on the potential reward rather than the possible risk. Despite the recent market decline the major trend is still positive. At the October 2007 high the monthly NYSE advance/decline line formed lower highs, line a, before it dropped below its WMA in January 2008. By the summer of 2008 the WMA of the A/D line was clearly declining but the selling did not pick up until the end of the summer.
Of course there is a well-known correlation between bear markets and recessions. As I discuss later there are actually signs that the economy is improving which is a further sign that a recession is not on the horizon. Also according to FactSet S&P earnings are likely to be positive this quarter for the first time since March of 2015. This could help investors justify buying stocks.
In September 2016 the A/D line made a new high, line b, but turned lower in October. It is still well above its rising WMA and shows no signs yet of topping out. The monthly chart of the S&P 500 shows that there is next major support in the 2000-2060 area while it would take a drop below 1800, line c, to turn the chart decidedly negative. The long term 20 month EMA is still rising. In the last bear market it turned lower in January of 2008 which also was the official start of the recession.
I have been discussing the demise of the hedge fund industry since July 2015 and last October I pointed out my surprise that a well-known mutual fund like Sequoia (SEQUX) had 28.7% in just one stock Valeant Pharmaceuticals (VRX).
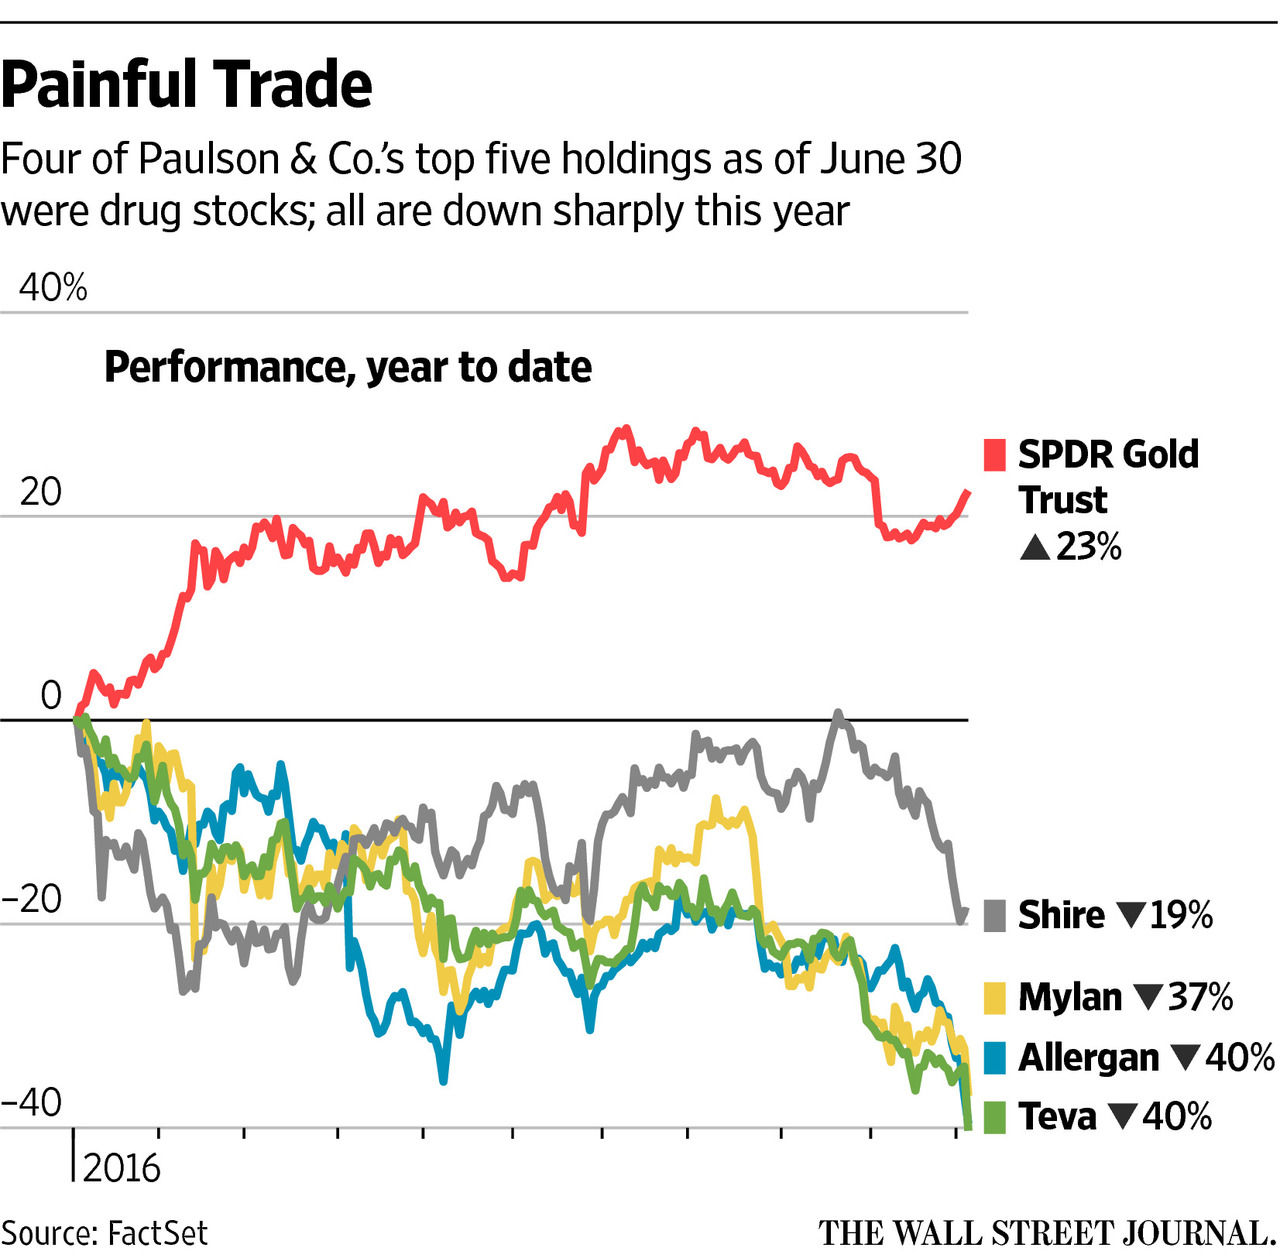
An article last week in the Wall Street Journal detailed the $26 billion loss of hedge fund giant John Paulson. It revealed that he like many other hedge fund managers broke every basic rule of common sense investing. The chart shows the performance of his top five holdings as of June 30 2015.
The largest holding Shire PLC (SHPG) is down 19% so far this year and his other major drug stocks are down much more. These four stocks now represent about 25% of his portfolio and as most investors know a diversified portfolio is a key ingredient to long-term growth.
A portfolio that is over weighted to a few stocks or a few sectors has the potential for large gains as well as large losses. In the Viper ETF Report I suggest that most only put 5% in any one sector though some experienced traders may have up to 10% when trading positions are included.
For any investment one should employ risk management so that one holding does not have too large an impact on your portfolio. This in my view was another problem with the Paulson investments as they failed to sell their drug stocks as they were dropping which made the losses much worse.
As I noted in October Valeant Pharmaceuticals (VRX) had topped out in September and since the end of October it has dropped from $182 to just over $19 per share. The stop below the long-term support at $186 would have saved Paulson and other hedge funds quite a bit.
For both ETFs and stocks selection I place quite a bit of emphasis on relative performance (RS) that compares the performance of an issue to the S&P 500. Those ETFs that are outperforming the S&P will do better when the market is rising and generally drop less when the market is declining.
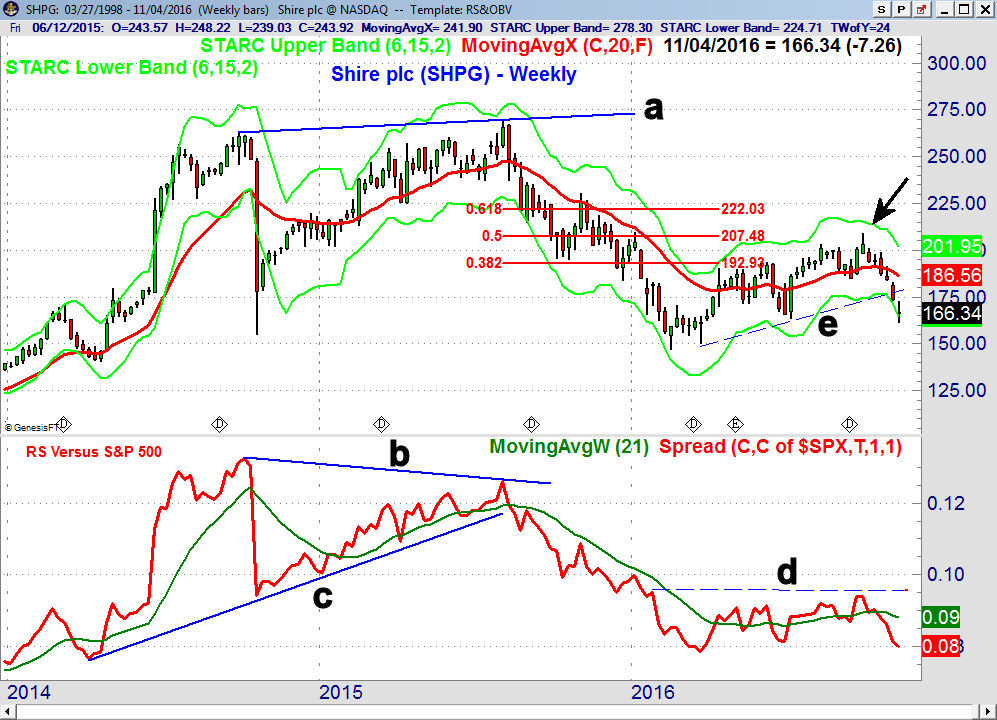
The chart of Shire PLC (SHPG) shows that it peaked in July 2015 when it made a high of $269.15, line a. The RS made a lower high, line b, and then violated support, line c, just a few weeks after the high. The RS declined into early 2016 but was only able to manage a weak rebound as it failed to move above the key resistance at line d.
Though SHPG did rebound it was only able to move slightly above the 50% resistance at $207.48 before it again turned lower. The break of the chart support at line e, was forecast in advance by the decline in the RS below its WMA.
The Economy
Last week's data on manufacturing was positive overall even though the Chicago PMI came in weaker than expected the ISM as well as the PMI surveys were better than expected. The data on the services sector was well above 50 and therefore still in the expansionary mode.
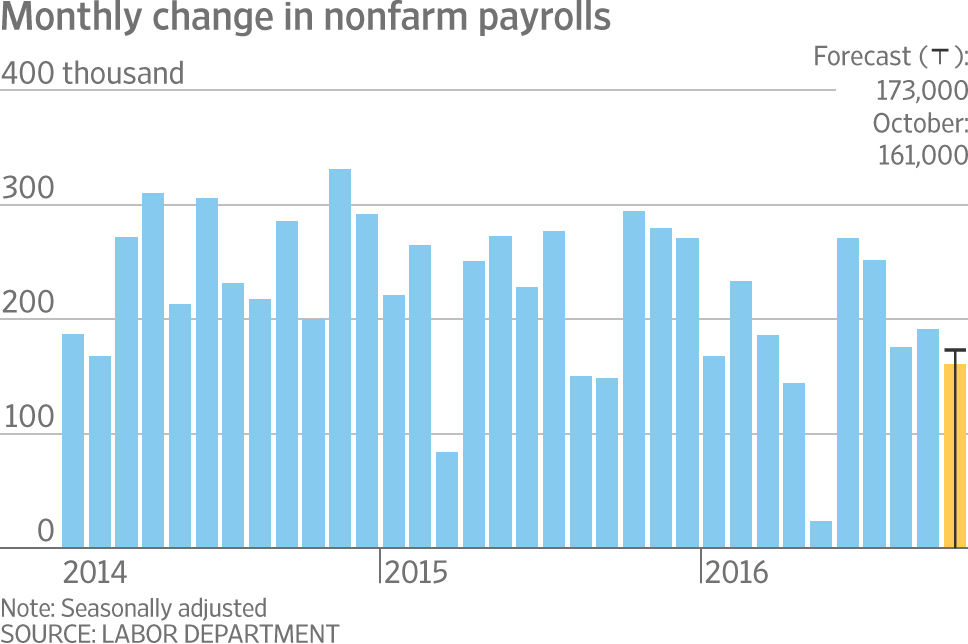
The nonfarm payrolls came in as expected and the upward revisions for the prior two months was also a plus. More importantly average hourly earnings were up 0.4% and 2.8% on a year on year basis which is a high for the recovery. This is in line with other data that suggests a slight rise in inflationary pressure which should help the economy strengthen further.
This Friday we will get the mid-month reading on Consumer Sentiment.
Market Wrap
The selling carried over to the Nasdaq last week as it lost 2.8% followed by 2% drop in the small cap Russell 2000. The S&P 500 was just slightly better as it declined 1.9%. Once again the Dow Transports bucked the trend as it was up 0.7% for the week. The market internals were quite negative again as the declining stocks led the advancing stocks by a 3-1 margin.
Technology took the biggest hit losing almost 3% while there was close to a 2% drop in oil & gas, consumer goods and health care. According to AAII the bullish % dropped 1.1% to 23.6% with just 34.6% bearish. Neither value is at an extreme yet but that may change over the next few weeks. The bullish % often drops below 20% at market lows.
The market internals moved into the corrective mode on October 7th and as I noted in at the time it could be a rough October as "the S&P 500 A/D line dropped back below its now slightly declining WMA". I also had to disagree with the bullishness melt-up outlook of the Fast Money traders on October 10th ("Stocks Melt Up? Not So Fast" ) as the rally had not moved the A/D lines out of their corrective mode.
Still I was surprised by the relentless nature of the current decline. As I have noted in the past once the A/D lines move into the corrective one cannot tell for certain whether the market will just see a 3-5% decline as it did last spring or whether a more serious correction is going to occur.
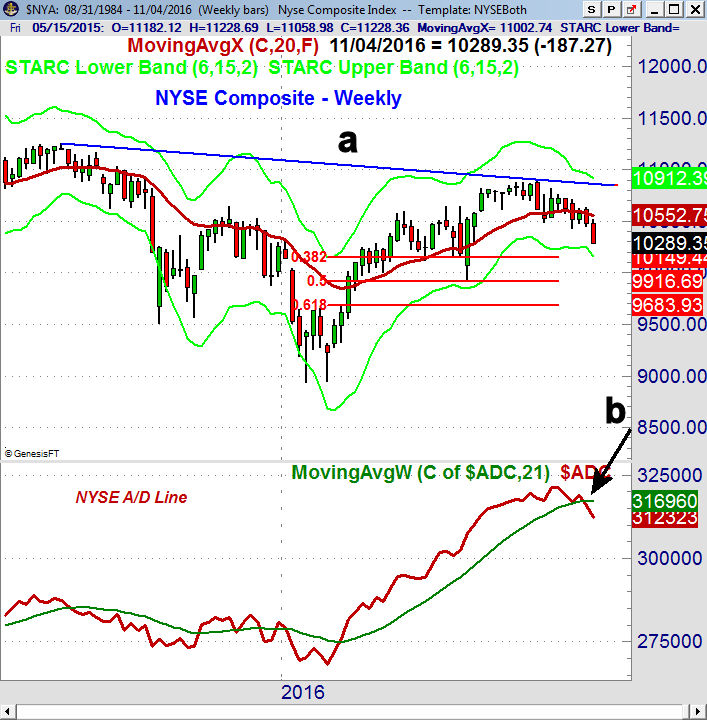
The NYSE dropped below support going back to early July last week which was consistent with the weekly A/D line dropping below its WMA (point b) at the end of October. The 38.2% support from the early 2016 low and the weekly starc- band are in the 10,149 area. The 50% support and the early July low are now at 9916. The flat 20-week EMA is now at 10,550 and it represents initial strong resistance.
The weekly A/D line has dropped below its prior low so now it is in a downtrend. This raises two likely scenarios for the weeks ahead. The bullish scenario would be a very powerful market rally in the next week or so that would take the weekly A/D line above its WMA. This would be signaled in advance by a break the daily downtrends of the A/D lines which are currently well above current levels.
The bearish scenario would be if the weekly A/D lines complete intermediate term top formations in the coming weeks. Typically this would mean that the weekly NYSE A/D line will rally back to its topping WMA before it again turns lower.
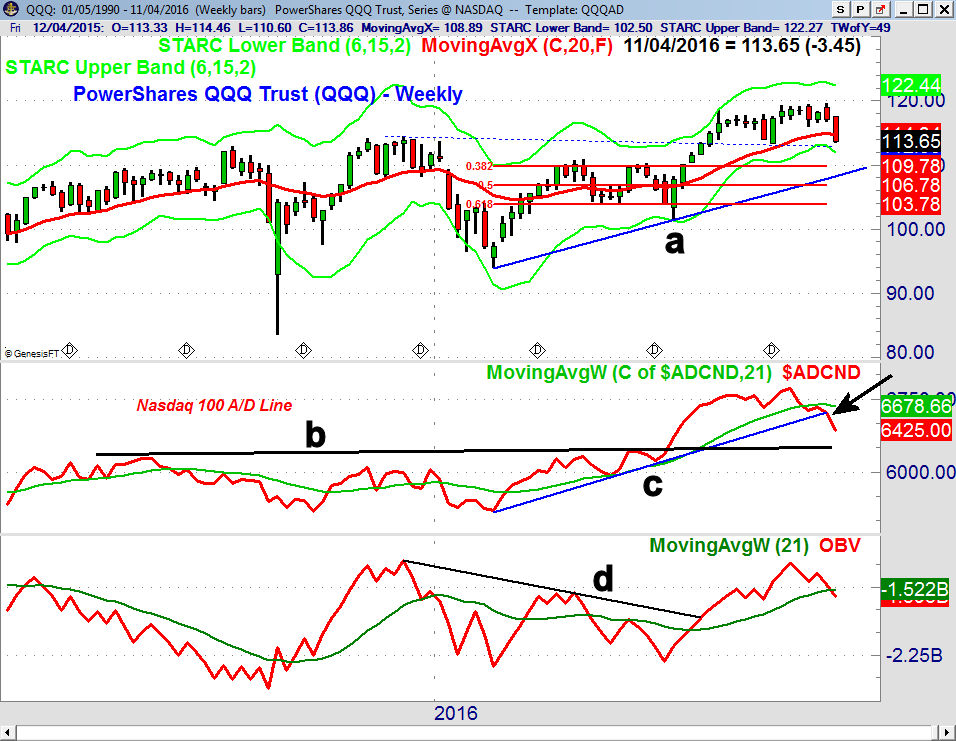
The PowerShares QQQ Trust (QQQ) closed Friday below its 20 week EMA and the quarterly pivot at $114.82. The weekly starc- band is at $111.97 with the major 38.2% support at $109.78.
The weekly Nasdaq 100 line has broken its uptrend, line c, as it has moved further below its WMA which is starting to roll over. It is still well above the major support, line b, from earlier in the year. The OBV has dropped below its WMA but the break through strong resistance at line d, is still a positive signal.
All of the sectors tracking ETFS are oversold as most tested their daily starc- bands last week. This does favor a sharp rebound or some sideways trading over the near term. The QQQ did form a doji on Friday so a trading buy signal is possible early in the week.
What to do? As I noted last week "the odds of a sharper correction in November are now higher." According to S&P's Howard Silverbatt there were only 14 instances of 9-day losing streaks since 1928. On the other hand the last 10-day slump in July 1975 was followed by a two-day bounce before there was another decline of 6.8%.
Though bond traders do not appear to be concerned a Trump victory in my view could cause some major disruption in the bond market which does also not like uncertainty. There were hints last week in the FOMC comments that such a victory would influence the expected December rate hike.
The action of the weekly A/D line does allow for a more protracted decline but there are still no signs like there were in 2007 and other major market tops that a bear market is beginning. With no signs of a bottom yet it is clear that the S&P 500 can drop further that last week's target in the 2080-2100 area with many now watching the 2040 level .
There have been no signs yet of a panic selloff but that could change this week depending on the election. I still think a panic selloff of 1-2% would be a good opportunity to do some initial buying in a low fee, broadly diversified ETF.
It is likely to take a few weeks before new daily buy signals are generated but our patience in February was rewarded. Those who are already long should wait for signs that the worst of the selling is over before adding to their positions. In the current market I would not chase the short side though Viper ETF traders are long the Direxion Daily Small Cap (TZA) and the ProShares UltraShort S&P500 (SDS).
Many of the market leading stocks like Facebook (FB) were hit with selling last week though because of our entry and stops we still made a profit. I have been favoring the short side for Viper Hot Stock traders but our strategy is still to wait for these stocks to rally back to resistance before new short positions are established.
Comments
comments