
Stocks traded in a narrow range heading up to the monthly jobs report as both the rallies and declines were short lived. The short-term technical readings had not moved firmly into the buy or sell mode prior to Friday's rally.
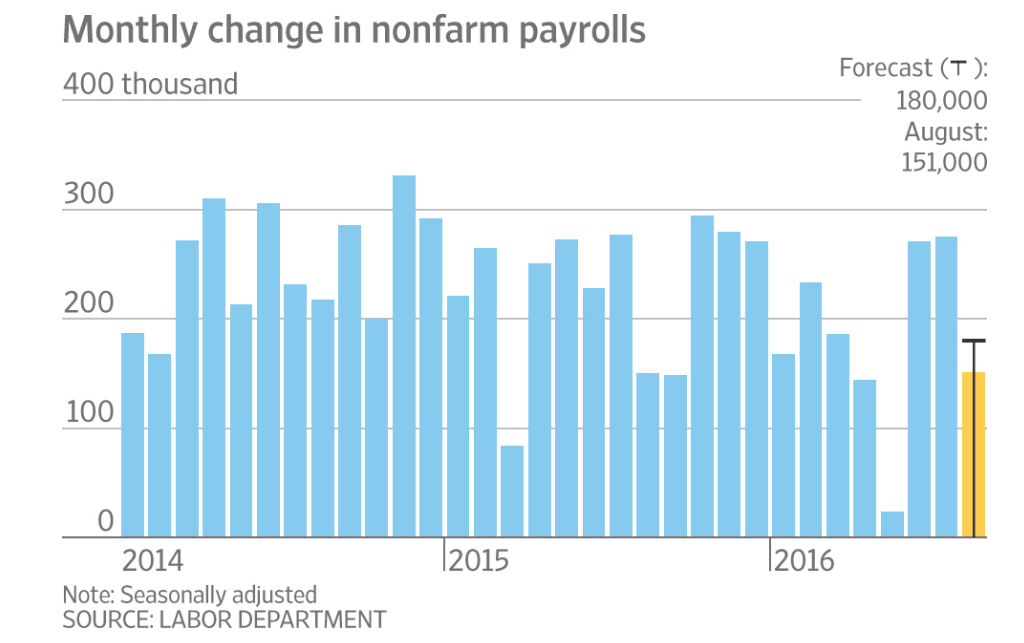
The weaker than expected change in non-farm payrolls is likely to decrease the odds of a Fed rate hike at their September 21-22 meeting but it is not likely to protect investors from a few weeks of mindless debate in the financial media. My advice last week was for investors to tune out when it comes to the Fed debate in the next few weeks.
This is due to my view that periods of low market volatility investors can more be easily scared by a spike in volatility and bearish commentary on the stock market or the economy. Over the past few weeks I was concerned about a sharp wave of selling but should investors now be worried about a market smack down in September?
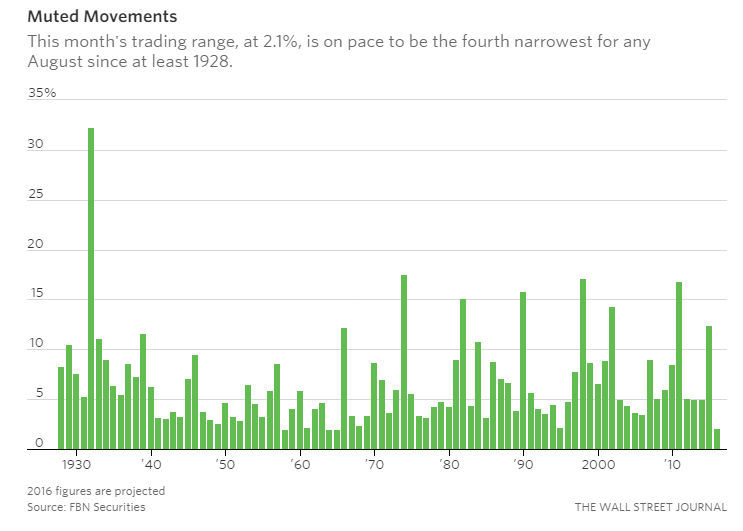
The narrow stock market ranges in August are clear from this Wall Street Journal chart. It shows that Augusts range was the fourth narrowest since 1928. Such a tight range with neutral technical readings can make it vulnerable to a decline that triggers sell stops which could take the market well out of its recent ranges.
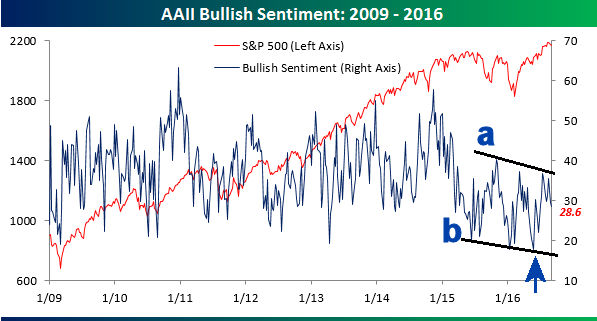
According to AAII the level of bullish % was down slightly to 28.6% while the bearish % rose to 31.5%. Both are pretty much in the middle of their two-year ranges, lines a and b, as I added some annotation to this chart from Bespoke.
Many will remember that the very low bullish % readings in February (see arrow) combined with the bullish signals from the A/D indicators helped me to conclude then that a market bottom was in place. At the time the outlook for the stock market on Wall Street was generally quite negative (Don't Follow Those Bearish Traders)
It is more difficult right now to assess the sentiment of the professionals and hedge funds towards the stock market. One recent article from Bloomberg "Smart Money Going to War With VIX-Obsessed Stock Market Bears" discussed how the large institutional investors were becoming more bullish and reducing their hedges.
The individuals on the other hand have moved $90 billion out of both ETFs and mutual funds since the start of the year which is near a record. This indicates that many investors are currently underinvested. There also had been a dramatic increase in the shares of one VIX ETN (a bearish bet on the stock market) which the article suggested was because of buying by individual investors.
I would expect that many active money managers and hedge fund manager are nervous about underperforming their benchmarks at the end of the quarter. Their performance has been lagging all year and their clients have been pulling money out for the past few months. They would likely welcome a market smack down this month.

Since August had one of the narrowest ranges since 1928 I though it might be interesting to look at what happened to the S&P 500 in those three years (1958, 1964 1965) when the ranges were even narrower. In August 1958 the S&P 500 broke out of its range in the middle of September and rallied over 27% before it peaked in August of the following year.
In 1964 the S&P 500 moved higher until the latter part of November before it corrected. It finished the year below the November highs but was strong again in early 1965 before it peaked in May. Also in 1965 the tight range in August 1965 was followed by another push to the upside in the S&P 500 as it did not top out until February of 1966.
This brief look at history suggests that a strong weekly close in the S&P 500 above 2200 should not be ignored. In the Market Wrap section I review the daily and weekly technical readings to determine if investors should still be worried about a September "market smack down."
For many years I have been pointing out the value of looking at the monthly charts and technical studies when you are selecting which stocks or ETFs to buy. At the end of each month I update the status of the monthly technical studies on the key ETFs for Viper ETF clients.
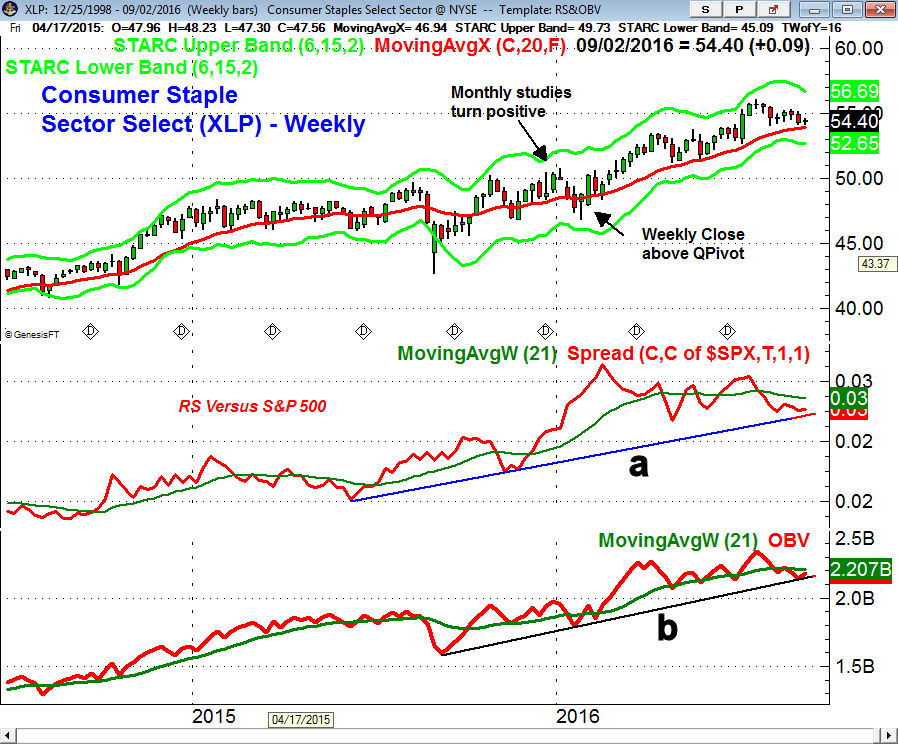
At the end of December 2015 the monthly indicators on the Consumer Staple Sector Select (XLP) turned positive. On January 29th XLP had a weekly close at $50.20 which was back above the quarterly pivot of $49.52. It has held above the quarterly pivot since January and the pivot is at $53.95 for the 3rd quarter. The relative performance and OBV have dropped back to support as XLP is testing its 20-week EMA. XLP has outperformed the SPY so far this year.
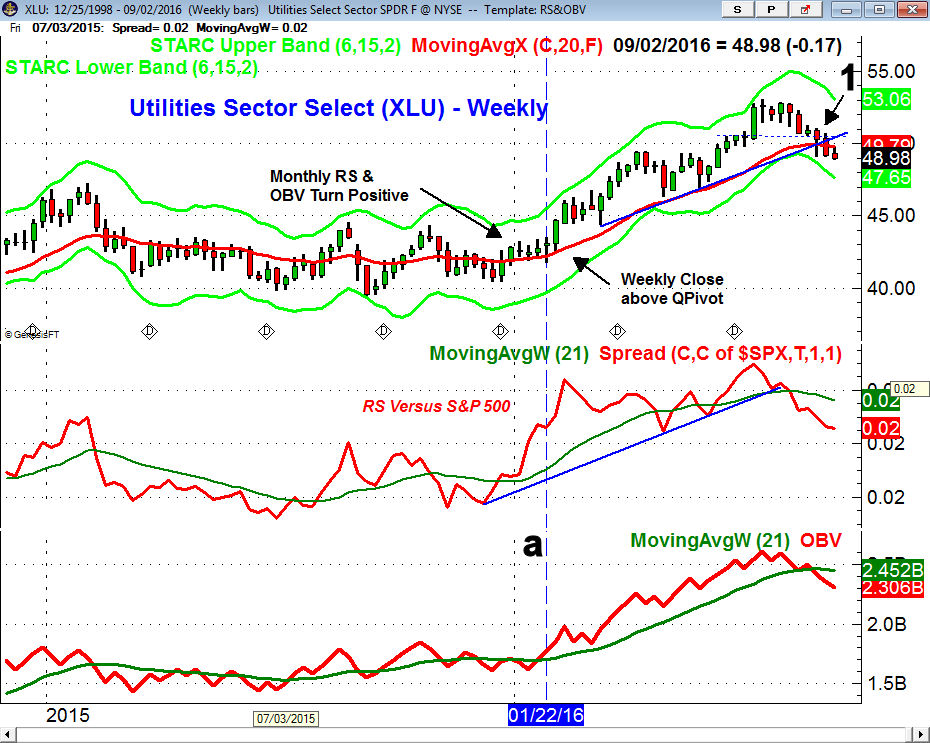
The monthly studies on the Utilities Sector Select (XLU) turned positive in December 2015. On January 22nd (line a) the weekly on-balance-volume (OBV) turned positive as the RS analysis indicated it was already a market leader. The next week XLU closed above the quarterly pivot at $43.43 for the first time in 2016. Just three weeks ago XLU closed below the 3rd quarter pivot at $50.57. This is now the key level to watch as the monthly studies are still positive for XLU but the weekly studies are negative.
The Economy
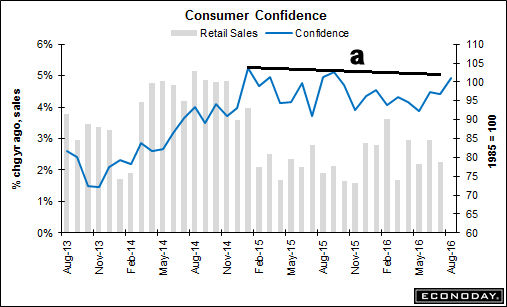
There were a number of other important economic reports last week in addition to the monthly jobs report. The S&P Case-Shiller Housing Price Index was down 0.1% for the third negative reading in a row. The Consumer Confidence came in at 101.1 and was much better than the consensus estimate of 97.3. It has turned up quite sharply and is now close to breaking through the resistance at line a. It has been acting stronger than the Retail Sales.
There was a slowdown in business according to the Chicago PMI as at 51.5 it was well below expectations but still above 50. That was not the case for Thursday's ISM Manufacturing Index which dropped to 49.4 the first reading below 50 since February. The PMI Manufacturing Index was not as weak coming in at 52. The data over the next few months needs to be watched closely.
On Tuesday we have the week's economic reports which are the PMI Services Index and ISM Non-Manufacturing Index.
Interest Rates & Commodities
Yields on the 10 Year T-Note bounced Friday but still closed the week lower. Like stocks yields have stayed in a tight range of 1.45% to 1.63% since July which has put some traders on edge especially with many still fearing a "bond market bubble".
It was another rough week for crude oil as a surprising jump in inventories last week gave traders another reason to sell. The 3% rally Friday helped the energy stocks but crude still lost 6.7% for the week. Though prices have reached more important support there are no clear signs yet of a bottom.
The precious metals also rallied in reaction to the jobs report as the gold futures closed $20 above the week's lows. One can make a case that the gold futures and the SPDR Gold Trust (GLD) may have bottomed but the Market Vectors Gold Miners (GDX) may need to retest last week's lows.
Market Wrap
The Dow Transports were up almost 1.6% last week much better than the 0.50% rise in the Dow Industrials and S&P 500. The small cap S&P 600 did do better up 1.3% and even the beaten down Dow Utilities managed a 0.90% gain. The 2-1 positive weekly A/D numbers indicates the market was stronger internally than the price gains indicate.
The financial and basic material sectors led the way last week with gains of 1.9% and 1.2% respectively. The oil & gas and health care sectors were both down 0.5% for the week. Most of the sectors were higher for the week.

The NYSE Composite gapped higher Friday and held its gains into the close. There is next resistance in the 10,935 to 11,014 area which includes the monthly pivot resistance. For September the monthly pivot stands at 10,754 with the 20-day EMA at 10,782.
The daily A/D numbers were over 4-1 positive on Friday and held up well throughout the day which is a bullish sign. The A/D line bounced from its WMA and it now needs to start rising strongly to confirm a new rally phase. The daily OBV has just bounced back to its WMA while the weekly OBV is well above its WMA.
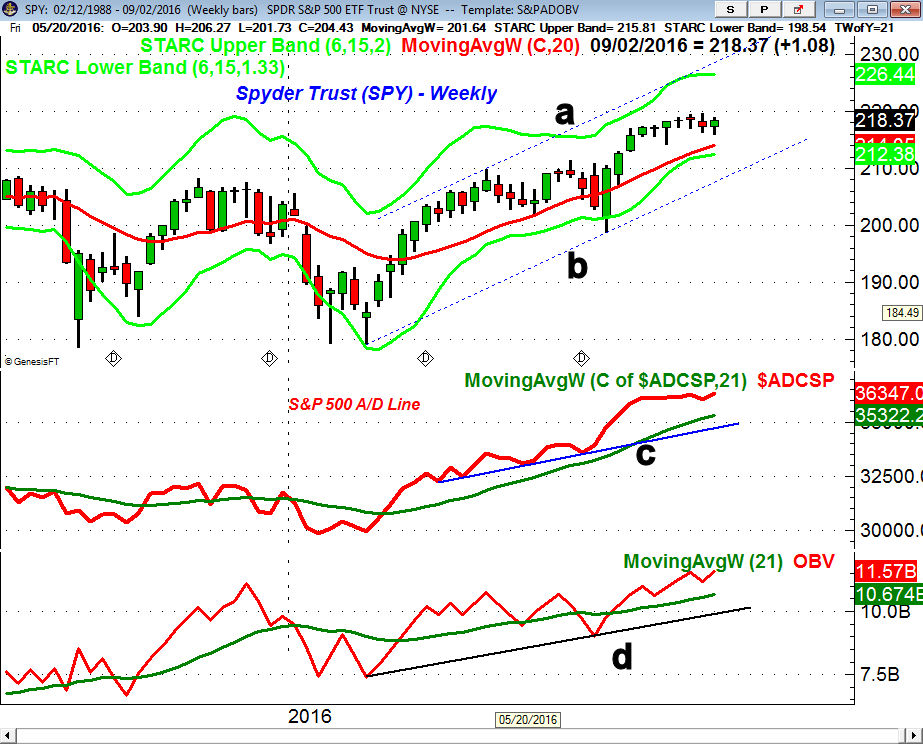
The weekly chart of the Spyder Trust (SPY) shows the recent seven week range with last week's close the highest since the week ending August 12th. The ability of the market to hold the $216 level now makes the support at $212.95 to $214.25 more important with the strongly rising 20 week EMA at $214.05. The monthly pivot resistance is at $222.21 with the weekly starc+ band at $226.44. The upper boundary of the weekly trading channel, line a, is in the $230 area.
The weekly S&P 500 A/D line closed at a new high last week even though the SPY did not. It is well above its rising WMA with trend line support at line c. The weekly OBV moved above its WMA in early July and made a new high again last week. The daily OBV on SPY as well as the S&P futures are still negative.
The iShares Russell 2000 (IWM) continues to lead the SPY, DIA and QQ higher. The Russell 2000 A/D line made new highs last Tuesday and Friday. The weekly A/D line has been rising sharply for the past three weeks and is acting much stronger than prices. The weekly starc+ band is at $129.34.
The PowerShares QQQ Trust (QQQ) has held firm over the past month. There is weekly support in the $113.22-$114.22 area with the rising 20-week EMA at $112.11.The monthly pivot resistance is at $120.01 with the weekly starc+ band at $122.34. The weekly Nasdaq 100 A/D line made a marginal new high last week and the daily A/D line is back above its WMA.
What to do? I have been cautious about the overall market for the past few weeks based on the sideways action of the A/D lines as Viper ETF Traders took profits in the SPY at $218 on August 17th which was just below Friday's close. It was my concern that market decline could cause investors to sell their positions before the market rally resumes.
In the past few weeks his has become a more popular opinion and last week's improvement in the weekly and daily A/D lines now makes a "smack down" less likely this month. The week's Barron's has a front page article "Strategists Say Beware the Bear" as their strategist survey reveals a cautious if not bearish outlook for the stock market in the last four months of the year. A more bullish strategy will be favored once the new rally phase in the A/D lines has been confirmed.
Those who followed my recent suggestion to remove the weaker issues from their portfolios should now have more cash to do new investing. Viper ETF clients are long a number of different sector ETFs and several are likely to be recommended next week. I have recently added coverage of 20 of the most liquid country and international ETFs.
If you prefer to trade stocks the Viper Hot Stocks Report recommends both long and short stocks positions based on the weekly scans as well as the monthly indicators. Each service is only $34.95 per month and includes regular trading lessons as well as the twice a week reports. New subscribers receive four of the most recent trading lesson and subscriptions can be cancelled anytime on line.
Comments
comments