
The stock market started the week under a cloud based on increased global tensions and holidays in the US and overseas. Heading into the last trading day before the Easter holiday stocks looked week technically but there were many signs based on my analysis that meant the risk was too high for new short positions.
Those on the short side were likely surprised by last Monday's strong performance. They may have felt better when the Dow Industrials dropped sharply last Wednesday in reaction to the weak earnings from IBM, Goldman Sachs and Johnson & Johnson. The shorts were squeezed once again on Thursday as stocks had their best day since March.
Most technical analysts do not consider the Dow Industrials to be a good measure of the overall market as it is a price-weighted average of just 30 large cap stocks. It can be important to market sentiment as more average investors are aware of its swings on a daily basis.
The SPDR Dow Industrials (DIA) has dropped 3.5% from the March 1st high to last week's low of $203.64. This low was just above the 50% retracement support at $203.38 which is calculated from the mid-January low. The next important support is in the $201.54-$202 area.
As regular readers are well aware the analysis of the advance/decline line plays an important role in my work. It is important to evaluate all of the major A/D lines to get a clear picture of the market's health.
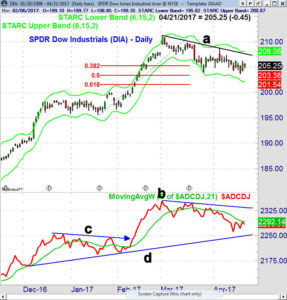

Both the weekly and daily Dow Industrials A/D lines did make a new high with prices in March. This is bullish for the intermediate term. The daily A/D line is currently below its declining WMA and is weaker than those on the NYSE, S&P 500, Nasdaq 100 or Russell 2000.
The daily Dow A/D line broke through resistance in February (line a) confirming the earlier bullish signals from the other A/D lines. The A/D is still above the stronger support at line d. It now needs to move above its WMA and the WMA has to turn higher to complete the bottom formation.
The steady decline in the Dow may be a factor in the nine week decline in the bullishness of the individual investor. It dropped to 25.7% last week losing down 3.3%. The table from AAII shows that it has dropped every week since it peaked on February 23rd at 38.5%. The bullish % is getting close to levels that it typically reaches when the market is bottoming. This of course will need to be confirmed by the technical studies but the bullish evidence is building.
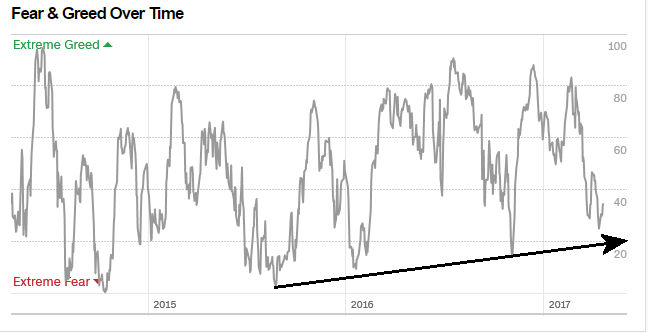
Market corrections serve to relieve extremes in both sentiment and price. The CNN Fear & Greed Index dropped into extreme fear territory last week as it reached the 25 area. It closed Friday at 35 but was above 80 and in extreme greed territory when the market peaked in March.
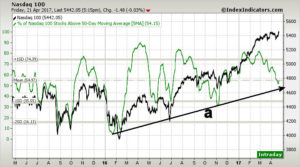

The 5 day MA of the % of Nasdaq 100 stocks above their 50 day EMA peaked at over 80 earlier in the year and is now back to the mean at 54%. It is holding above the long-term uptrend, line a. It dropped to near 40% at the pre-election low. This is another bullish sign for buyers of Nasdaq 100 stocks which are scanned for the Viper Hot Stocks Report.
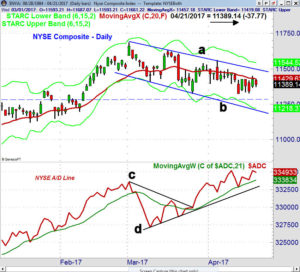

While the Dow A/D line has been declining the NYSE A/D line has been in a steady uptrend, line d, since the middle of March. The downtrend in the A/D line was broken in the late March and it made significant new highs on April 11th. It clearly has been leading prices higher.
Though this is due in part to the strength of the bond market I have been following this A/D line for 30 years and it has kept me on the right side of the market. The completion of the continuation pattern in the NYSE Composite (lines a and b) would have upside targets in the 11,800-850 area.
As I discuss in the Market Wrap section the weekly and daily Nasdaq 100 A/D lines made new all time highs last week. The relative performance analysis, a ratio of the ETF or stock to the S&P 500 or Spyder Trust (SPY, plays an important part of my selection of ETFs and stocks.
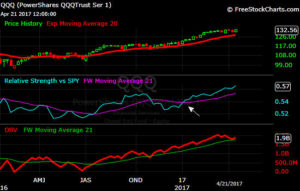

This chart from www.freestockcharts.com shows that the relative strength versus the SPY has been positive all year and it made another new high last week. Buying the market leaders in ETFs or stocks allows one to maximize the profit potential when the market is moving higher and helps one ride out most corrections.
The market did get a boost late last week over the hopes for a new tax plan but I would not count on it. Even though only 6% of the S&P have reported earnings, 75% have beat earnings. Over the past six weeks many bears have used the prospect of weak earnings as a reason not to buy stocks. If the early positive trend in earnings continues it will be another bullish argument for stocks.
The fact that the weekly A/D lines for the NYSE, S&P 500 and Nasdaq 100 is are now above their WMAs suggests that the correction from the March highs is in the process of ending. The improvement in the small cap Russell A/D line is also encouraging. The wild card of course is the elections in France as if the far right and communist candidates qualify for the runoff election then Monday's action could be wild.
The Economy
Overall the data was strong last week despite many misgivings that some have about the strength of the economy. Though Housing Starts dropped early in the week builder sentiment was strong from the Housing Market Index and on Friday Existing Home Sales surged 4.4%.
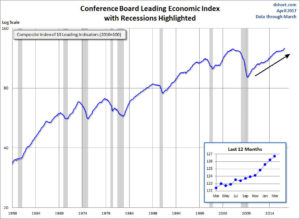

Thursday's all-important Leading Indicators (LEI) which is made up of 10 indicators was stronger than expected at 0.4%. This continues to signal a positive trend for the economy. As this excellent chart from dhsort.com illustrates it has a good record of topping out well before a recession (shaded in grey on the chart). The insert shows the strong surge in the LEI since last September.
The Philadelphia Fed Business Outlook Survey was a bit lower than the consensus but as Econoday commented "This closely watched advance indicator has been pointing to strong acceleration for the nation's factory sector". Friday's flash PMI Composite did show a loss of some momentum over the past few months.
The calendar is full this week with the Chicago National Activity Index and Dallas Fed Manufacturing Survey on Monday. Then on Tuesday we have the S&P Corelogic Case-Shiller HPI, New Home Sales, Consumer Confidence and the Richmond Fed Manufacturing Index.
On Thursday we get the Durable Goods orders and Pending Home Sales Index followed on Friday by the GDP, Employment Cost Index, Chicago PMI and Consumer Sentiment.
Market Wrap
All of the major indices were higher last week led by the 2.9% rise in the Dow Transports and the 2.6% gain in the Russell 2000. Both outpaced the 0.50% rise in the Dow Industrials and the 0.8% gain in the S&P 500. The weekly A/D numbers were strong with 2055 advancing stocks and just 1009 declining issues.
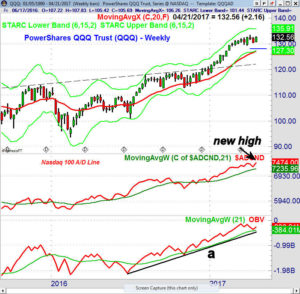

The Powershares QQQ Trust (QQQ) was up 1.6% last week which indicates the major uptrend has resumed. The weekly starc+ band is at $135.91 with the quarterly pivot resistance at $137.11. The weekly Nasdaq 100 A/D line made a new high last week as did the daily A/D line (not shown). It has turned up quite strongly after holding well above its rising WMA.
The weekly OBV has also has turned up after dropping back to its WMA. There is short-term support at $131.61 and the rising 20-day EMA. The monthly pivot support is at $130.28 with the quarterly pivot at $128.
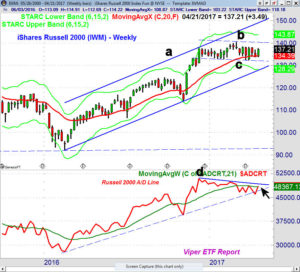
The decline in the daily Russell 2000 A/D line has been the focus since the early March high. The weekly A/D line has flip flopped as it has moved above and below its WMA. The weekly A/D line has again moved back above its WMA and is close to its recent highs.
A move through the downtrend, line d, is needed to confirm that the correction in the IWM is over. The daily A/D line has moved above its short-term resistance but needs a strong close to overcome its next level of resistance.
The weekly starc+ band is at $143.87 and the completion of the weekly trading range, lines b and c., has upside targets in the $148 area. This is fairly close to the upper boundary of the trading channel, line a. There is short-term support now at $135.95 and the 20-day EMA with further at $133.68.
The S&P 500 weekly A/D line has also moved above its WMA and the Dow Industrials is close as it has been hurt by the drop in some of the large cap stocks.
What to do? The strong action last week and the improvement in the weekly A/D lines suggests that worst of the correction is over. There could be a sharp drop next week in reaction to the French elections or a legislative failure by the Trump administration. A higher close this week and positive A/D numbers should confirm that the positive intermediate term has resumed.
This should take the QQQ and SPY to significant new highs and there are signs that the small cap stocks may start to lead the market higher. The Spyder Trust (SPY) never made it to our next buy level for those who are underinvested. I would still suggest you use any weakness to increase your exposure to the stock market.
Viper ETF subscribers are holding long positions in the QQQ and as well as other sector ETFs. New positions were added in a small cap ETF near Thursday's low. If you are interested in specific buy and sell advice in ETFs you might consider a one-month investment.
Traders following the Viper Hot Stocks Report are holding both long and short stock positions There were quite a few more new buy then sell signals last week so I will be favoring the long side next week.
Comments
comments