The rally in the Dow Industrial Average last week above 18,000 got the attention of many investors as well as the general press. The Dow made its high for the week on Wednesday as it reached a high of 18,167 which was just 1% below the May 19, 2015 all time high of 18,351.
The mid-week review of the technical outlook "Charts Talk-Fear Walks" I discussed the recent new highs in both the NSYE Advance/Decline and S&P 500 A/D lines. The fact that these measures of the market's internal strength are acting stronger than prices means that the NYSE Composite and S&P 500 are both likely to make new highs.
The NYSE Composite is still lagging the other major averages as it is over 7% below the May 2015 high. The S&P 500 is just 2% below its high and the Dow Industrials is a bit closer as it is just 1.9% under the 2015 high. There has been much talk above the lagging action recently of the technology stocks as the Nasdaq 100 is still 6.1% below its all time high.
So what is likely to happen when the major averages do make new highs?
As the Nasdaq Composite was making a new bull market high in March 2000 there were few signs of concern in the financial media as one headline at the time stated "Dow 36,000? Why Stop There?" The Dow had made a high two months earlier at 11,750.
In an article from the day the Nasdaq Composite peaked above 5,000 some of the analysts commented that the Dow Industrials was going to continue to lag the Nasdaq Composite where the sentiment was more positive. Here are some comments;
"the Nasdaq could hit 6,000 before the end of next year."
"Rising rates won't hurt the new techies, but they might impact the 'old economy' customers,"
Clearly the sentiment was overwhelmingly bullish as noted in a 2010 CNET article. "An undeniably prescient strategist at Warburg Dillon Read, now part of UBS, told the New York Times that "I don't see the end in sight." The Los Angeles Times quoted a Banc of America Securities analyst as saying that, before "too long," the Nasdaq index would double.
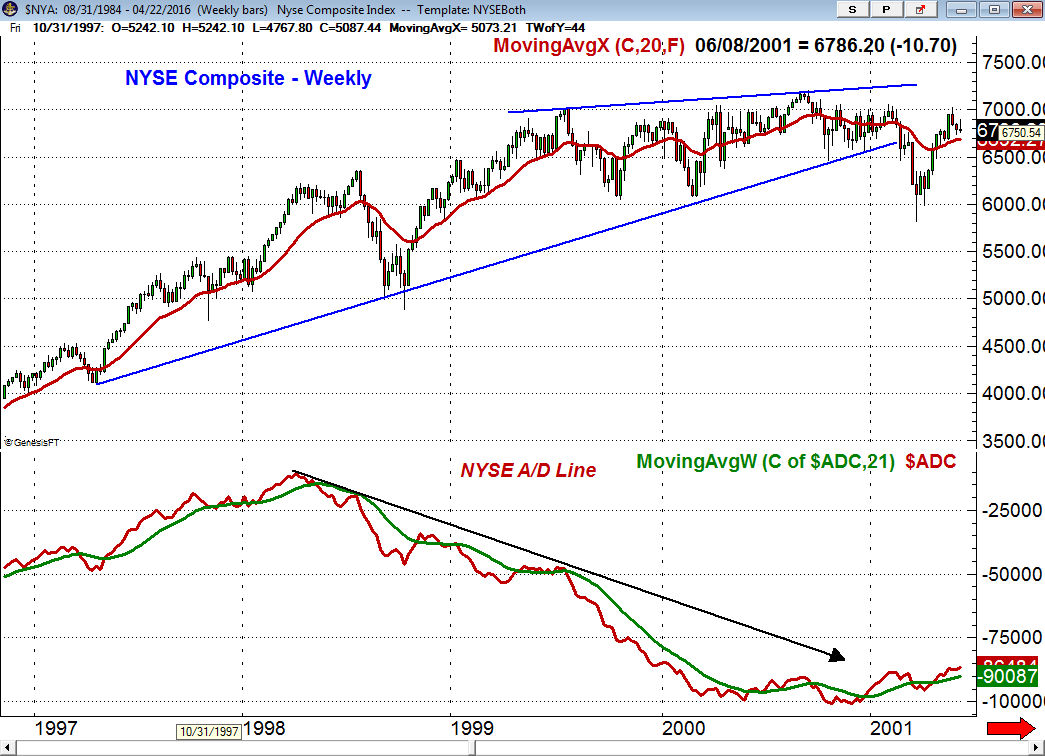
The NYSE Composite peaked after the Nasdaq in September 2000, line a, and did not break its major uptrend (line b) until February 2001. The NSYE A/D line, as well as the Nasdaq Composite A/D line, had been diverging from prices since early 1998, line c. This was a sign that the rally over the past two years was narrowly based as just a few stocks were pushing the overall market higher.
The analysis of the advance/decline line has played an important role in my analysis for over 30 years and as I reviewed in "One Indicator Stock Traders Must Follow" the divergences do not always persist as long as they did in 1998-2000 before the market tops. In my experience the A/D line is much better identifying market bottoms. This chart of the NYSE Composite that I posted on February 25th, just before the bear market low, reflected the bullish divergence in the A/D line.
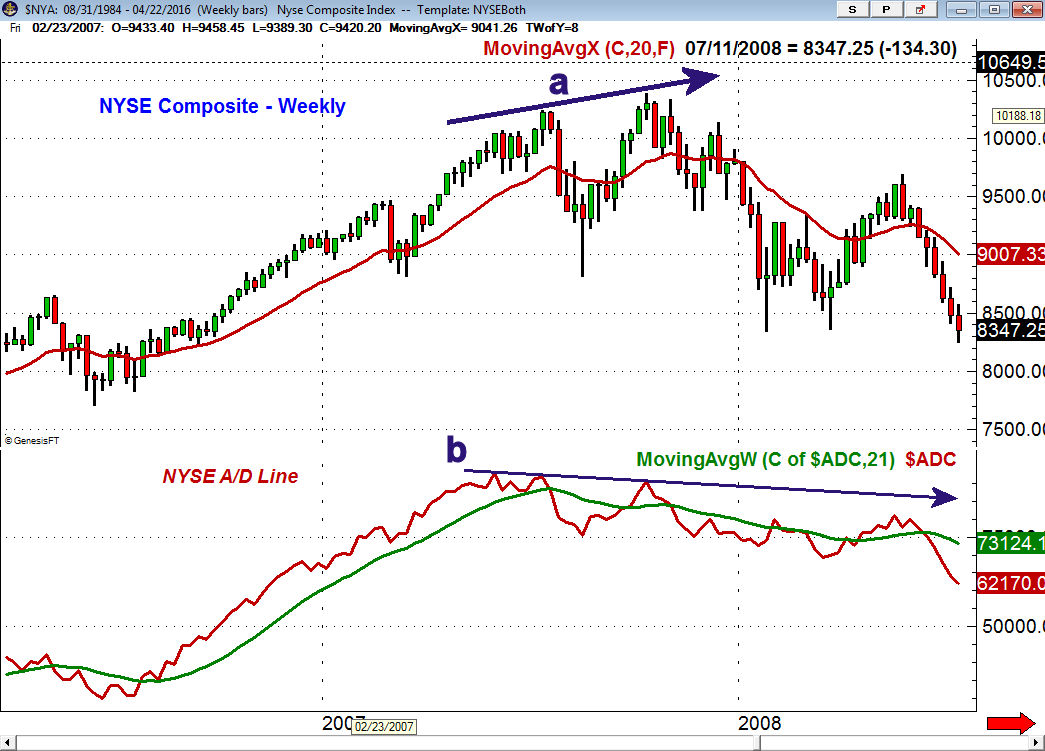
In 2007, the NYSE A/D line peaked in June 2007 and then formed a lower high in July, line b. As the NYSE Composite was making a new high in early October (line a) the A/D line just rallied back to its downtrend, line b. This additional bearish divergence warned that the market was now quite vulnerable and that it was likely topping out.
The subsequent decline confirmed the negative divergence and signaled a new market downtrend. During the bear market rally in 2008, the A/D line failed to come close to this downtrend. The NYSE A/D line continued to lead prices lower as the market started to plunge in June.
As stocks were making their high in 2007 there was also plenty of optimism about the stock market and the economy. As noted in Bloomberg on October 12th "Some fearless forecasters predict that the Dow will streak to 16,000 and that the Standard & Poor's 500-stock index will go to 1,700 over the next 6 to 12 months."
Some analysts did express concerns over the Fed's rate cut the prior month and the potential risk from the housing market. Few recognized that home building sector had completed a major top in June 2006. There was little concern over the economy except for those who had been warning about an economic collapse for several years. My favorite economic indicator, the Leading Economic Index (LEI), peaked in 2006.
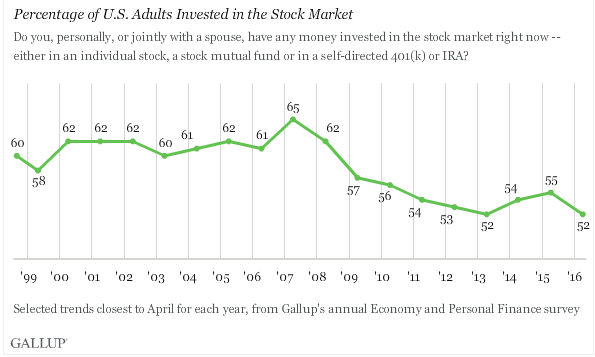
Clearly in 2000 the public was heavily involved in the dot.com stock boom and the annual survey from Gallup suggests it was even higher in 2007. Their results show 65% of individuals or jointly with a spouse was invested in the stock market. The percentage dropped to a low of 52% in 2013 and has risen only slightly this year to 55%.
The current low level of investor participation is not what one would typically see at a bull market high. The failure of the S&P 500 to hold above the 2100 level last week is already causing some concerns about the health of the stock market rally. Once we do see new highs I would expect to see a surge in articles that argue that the bull market is over.

This is why I think the current market is a "Bull in Sheep's Clothing" as the market's underlying strength is being camouflaged. The strong action of the Advance /Decline lines (see market Wrap Section) is a clear sign of the market's underlying strength with the low level of investor participation it is a strong indication that a new high in the averages will not coincide with a major bull market top.
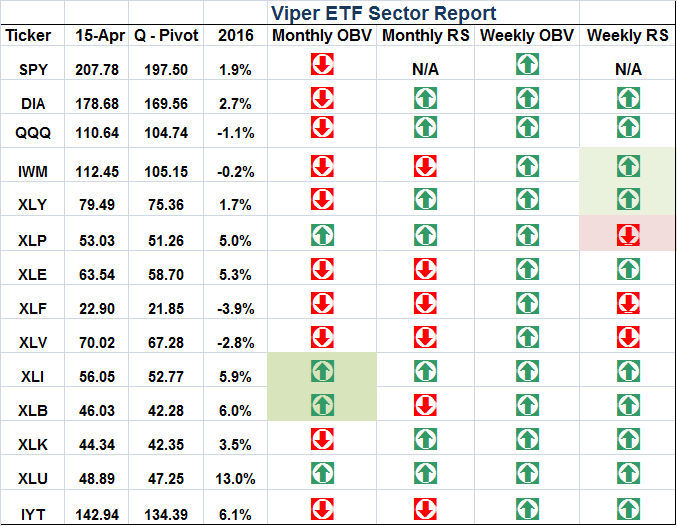
The first meaningful correction should provide a good opportunity to buy some of the market leading ETFS. The Viper ETF Sector Report helps to identify the market leading ETFS. It combines the quarterly pivot, relative performance and volume analysis to target the best ETFs for investors as well as traders.
In February it targeted the Materials Sector Select (XLB) and the Utilities Sector Select (XLU) which have been two of the best performers. We took profits in XLU but are holding over a 20% open profit in XLB and last week's longs in the SPDR S&P 500 Oil & Gas (XOP) are already up over 13%. (The Viper ETF Report is just $34.95 a month and subscribers also get two free trading lessons)
The Economy
It was a mixed week for the housing market as last Monday the Housing Market Index came in at 58 as it was unchanged for the third month in a row. This suggests that builders are definitely confident but the low level of traffic is limiting the enthusiasm.
Housing Starts in March were surprisingly weak falling 8.8% as both single family and multi-family components were weak. The Existing Home Sales data on Wednesday was much stronger than expected as they rose 5.1% but had been revised downward in February by 7.3%.
The Philadelphia Fed Business Outlook Survey was expected to come in at 9.0 but instead was -1.6 down from the prior month's reading of 12.4. This will makes the readings over the next few months more critical as stronger numbers will be important as we head into the summer months. The Chicago Fed National Activity Index was also weak in March.
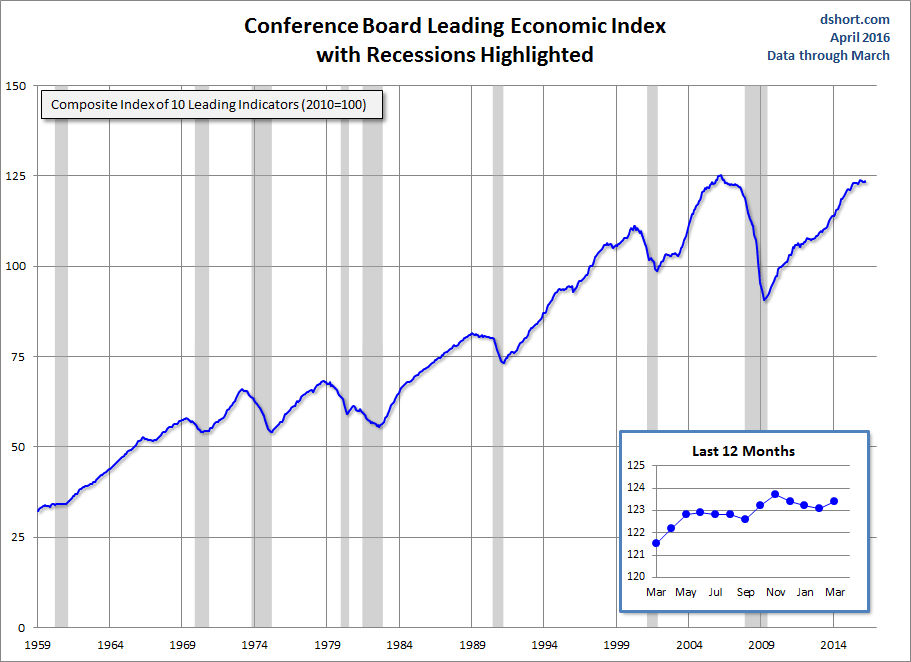
The Conference Board Leading Economic Index rose 0.2% in March after dropping the past three months. The chart suggests there may be some loss of upside momentum but there are no clear signs yet that it has topped out. Friday's flash reading on the PMI Manufacturing Index was 50.8 which is positive but not impressive.
On Monday we have the New Home Sales and the Dallas Fed Manufacturing Survey with Durable Goods, the S&P Case-Shiller HPI and Consumer Confidence on Tuesday. The FOMC meeting also starts on Tuesday with the announcement on Wednesday afternoon. I am not expecting any significant change though volatility could increase.
The Pending Home Sales Index will be released Wednesday with the advance reading on 1st quarter GDP on Thursday. The Kansas City Fed Manufacturing Index is out on Thursday while Friday we get the Personal Income and Outlays, Employment Cost Index, Chicago PMI and Consumer Sentiment.
Interest Rates & Commodities
The yield on the 10 Year T-Note increased slightly last week to 1.888% with next short term resistance now at 1.940%. A strong close in yields above the mid-March high of 2.020% would signal even higher yields.
Crude oil's drop at the start of the week was a good entry point as the June contract had an overnight low of $39 but then closed the week at $43.76. The weekly studies are positive but the there are some signs from the daily technical studies that the rally is losing some upside momentum. The technical studies still look strong on the energy sector but a pullback would not be surprising.
The strength of crude oil has been due in part to the lower dollar and more global analysts are have finally become aware of its weak technical outlook. The top in the dollar index was identified in early February "Is This The Stock Market's Secret Weapon?" when I suggested as weaker dollar could be supportive for stocks prices.
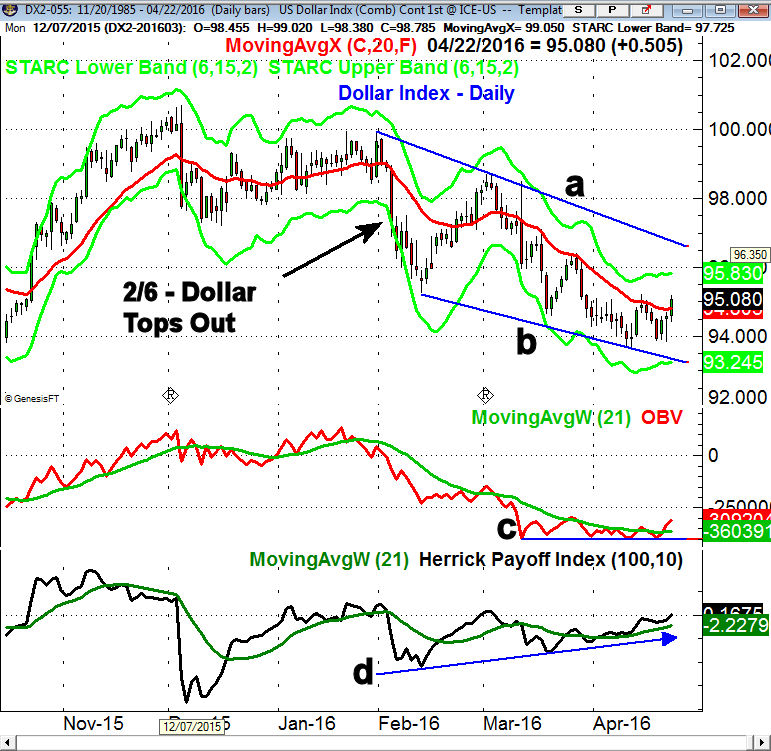
The daily studies on the dollar index futures are now suggesting it may be forming a short term bottom. The daily chart suggests a potential falling wedge, lines a and b. There is initial resistance in the 9600 area with stronger in the 9700 area. The daily on-balance-volume (OBV) shows a short term bottom formation, line c, as it has moved above its WMA. The HPI, which uses volume and open interest, has been diverging from prices (line d) and is now slightly above the zero line.
Market Wrap
The Dow Industrials and S&P 500 gained just over 0.5% last week but lagged behind the action of the Dow Transport and Russell 2000 that were both up over 1.3%. The Dow utilities were hit hard as they closed down 3.5%. The market internals were 2-1 positive which has pushed the NYSE A/D line to another new high.
The weak earnings from tech giants Microsoft (MSFT) and Alphabet (GOOGL) pressured the technology sector which lost 1.9% for the week. There were a number of Nasdaq 100 stocks that bucked the trend as several of our Viper Hot Stock picks were up over 1% for the week. The oil & gas stocks were the big winners up 5.5% while health care and material stocks also recorded nice gains
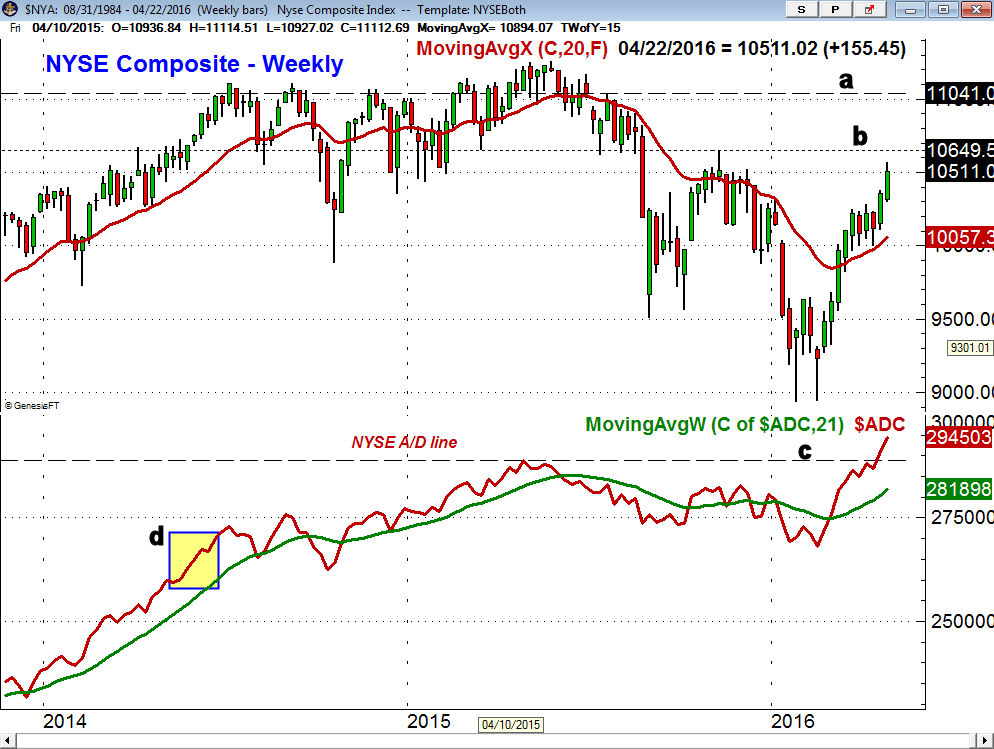
The weekly chart of the NYSE Composite shows that we are now closer to the next meaningful resistance at 10,649 (line b) with more important above 11,000, line a. The surge last week creates a band of good support now in the 10,000 to 10,200 area. The weekly NYSE A/D line is still rising very sharply and continues to lead prices higher. In June of 2014 a similar pattern in the A/D line was followed by five more weeks on the upside.
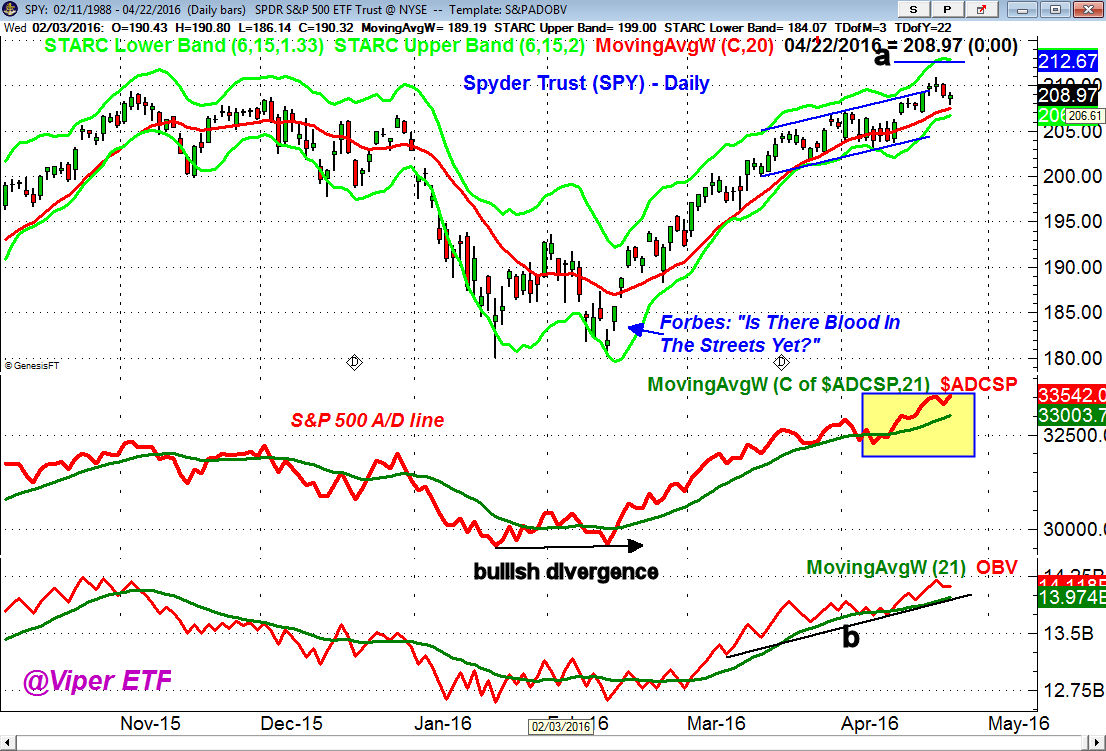
The Spyder Trust (SPY) broke out of its trading range last week as it surged to new rally highs on Wednesday. There is next resistance in the $212.50-$213 area with the quarterly pivot resistance now at $214.70. The setback last week looks pretty normal as it has just taken SPY back to the 20 day EMA. There is further support in the $207 area.
The S&P 500 A/D line is still acting stronger than prices as the A/D ratios were positive on Friday despite what many thought of as the market's overall negative tone. The A/D line now has good support at the late March and early April lows which if broken would be a sign of weakness. The daily OBV also made a new rally high last week and is well above its WMA.
The iShares Russell 2000 (IWM) closed on the highs last week and looks ready to test the next major resistance in the $116-$117 area. The Russell 2000 A/D line also closed on its highs and we are still holding our long positions in IWM but looking to taking partial profits at higher levels. The SPDR Dow Industrials (DIA) also is acting strong but it is getting closer to my target levels.
The PowerShares QQQ Trust (QQQ) was down 1.5% on Friday and has already reached first good support. As I noted earlier the decline was concentrated in just a few stocks and the A/D line is holding up well and is still close to its highs. This makes the action early in the week as those short the QQQ may now get squeezed.
What to do? The market's internal strength on Friday suggests that the recent pullback may be over soon and that it is not the start of a deeper correction. The FOMC meeting may cause an uptick in volatility and if we do have a deeper stock market correction it should cause an increase in negative bets. Many are watching the low VIX level as another reason to bet on a deeper market correction.
Once the S&P 500 is able to make new highs I think one should be prepared for a round of selling but not a significant market top. Of course it will be the daily analysis of the A/D lines that will warn us if the market is vulnerable to a deeper market correction.
I continue to expect a sharper market correction in the next few months which should create a better opportunity for long term investors. The weekend scans of both stocks and ETFs are identifying some good opportunities each week but be sure you pay close attention to the risk of any new positions.
Comments
comments