

It is doubtful that anyone will forget last week for many years to come. The political and financial ramifications will have an impact for the next four years or more. Though it is way too early to guess what will happen it is unlikely than pollster will be one of the top ten career choices for new college graduates.
It was certainly perplexing week for the market but last week's action is should influence stocks for the rest of the year. The corrective patterns in the A/D lines as we started the week suggested the bounce before the election did not mean that the correction was over but the post-election action has changed that view.
The futures markets conviction over a Clinton victory ended about 8:00-8:15 EDT as after trading as high as 2152.50 it closed at 2140.25. The selling was relentless for the next four hours as the S&P futures bottomed out at 12:15 AM as the S&P futures hit a low of 2028.50. At the lows the S&P futures were down 107 points or over 5%. Just over four hour later the futures were back above the 2100 level.
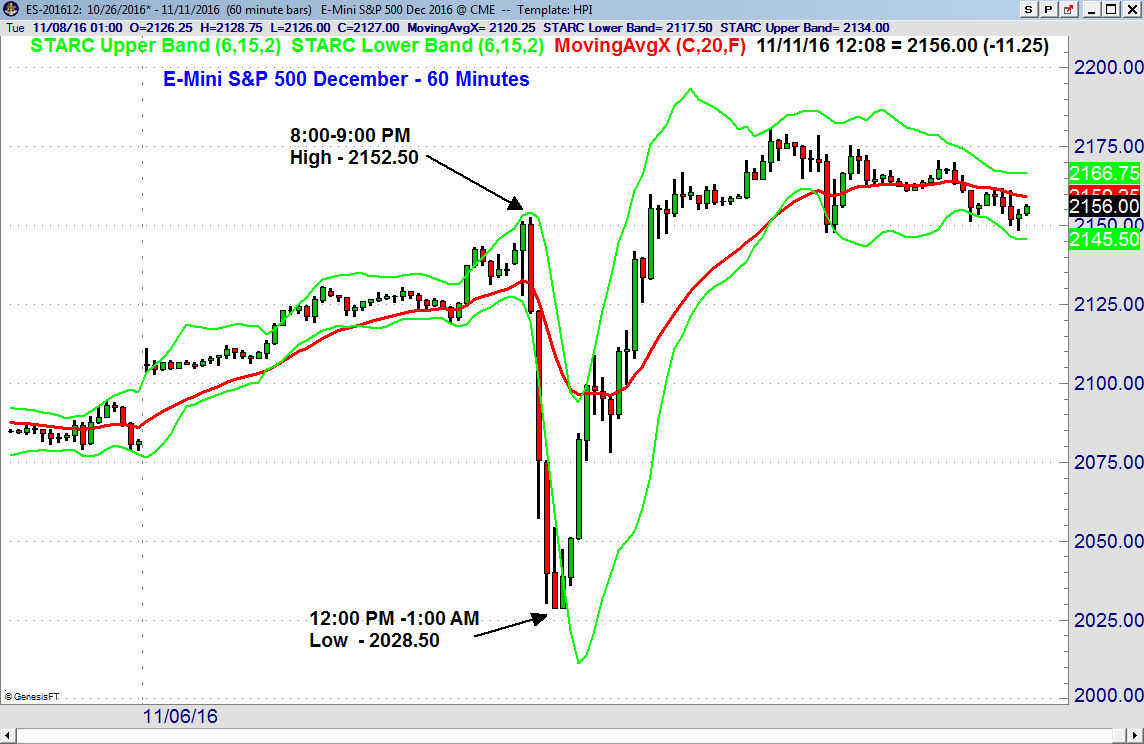
The futures markets conviction over a Clinton victory ended about 8:00-8:15 EDT as after trading as high as 2152.50 it closed at 2140.25. The selling was relentless for the next four hours as the S&P futures bottomed out at 12:15 AM as the S&P futures hit a low of 2028.50. At the lows the S&P futures were down 107 points or over 5%. Just over four hour later the futures were back above the 2100 level.
The fact that the selling was absorbed by the futures market overnight was a blessing for investors but not all traders. Those were long inverse ETFs or put options did not have the opportunity to reap the same gains as futures traders. If the futures had even been down 40-60 points when stocks opened at 9:30 AM Wednesday morning it would have been ugly.
It is likely that panic selling would have occurred as many widely held ETFs would have opened sharply lower taking many investors out of their positions near a short-term market low. This is why I feel investors really did dodge a bullet on last Wednesday's open.
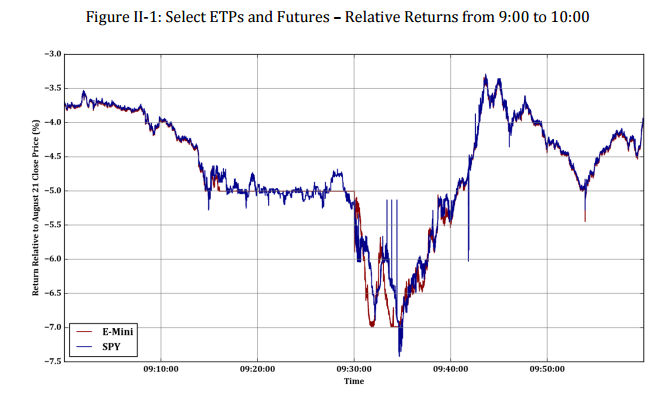
It could have been as bad as August 24th of 2015 when the Dow Industrials dropped 1000 points in early trading. The chart above from an SEC Report shows that the S&P futures were down slightly over 5% as the stock market opened. In just five minutes the futures were trading almost 7.5% lower and the SPY was trading down 7%.
The SPY had dropped 5.6% the previous week so the sharply lower opening added to investor's pain but 10 minutes after the lows the losses had been cut in half. From the low on Monday August 24th at $177.63 the SPY rebounded to close the week at $194.03 as it was up slightly for the week.
It was not until early October (A Surprising Turn In Stocks This Week?) that the market internals indicated that a bottom was in place and that a buying opportunity was at hand. There are some ways that once can identify a panic low and one of my favorite techniques is to use the starc bands.
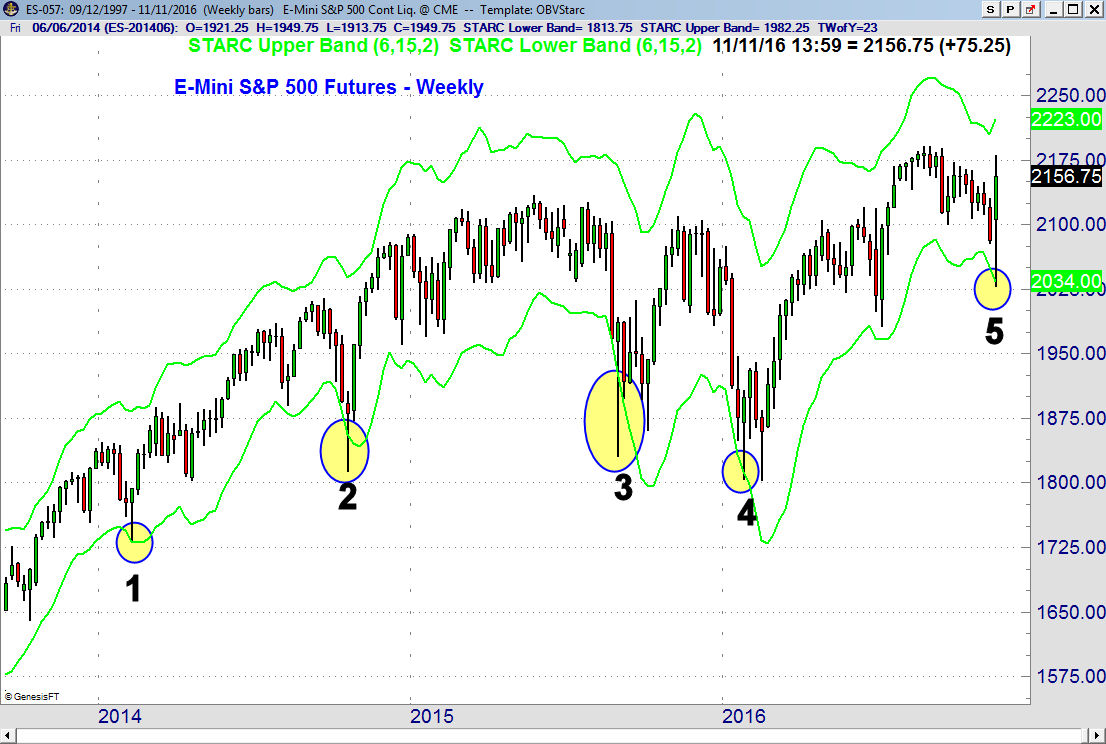
This weekly chart of the continuous E-mini S&P 500 contract reveals that since 2014 prices have only dropped below the starc- band five times. The long tail (the bar under the candle body) is an indication of demand at lower levels. In early February of 2014 (point 1) the futures had a low of 1732 on Wednesday and then closed the week at 1793 as the NYSE A/D line moved above its WMA.
There was a similar price extreme in the middle of October 2014 (point 2). In this instance the S&P futures dropped in part to a panic in the bond market. The futures had a low of 1813 on Wednesday October 15th before the futures rallied nicely to close the week higher at 1880. Three days later the daily NYSE A/D line turned positive as it broke through its downtrend (October 17th Buy Signals Get Stronger).
The weekly starc- band was also slightly broken in January of this year (point 4). The weekly bar also shows a long tail as the S&P futures bottomed on Wednesday January 20th before also closing the week higher. These lows were slightly broken in February but the starc- band was not reached. The market internals and sentiment signaled on February 23rd that a bottom was in place.
Of course just because the futures drop below the weekly starc- bands does not mean that the market must have completed a bottom. As discussed in the Market Wrap section even though some work needs to be new buy signals are looking more likely.
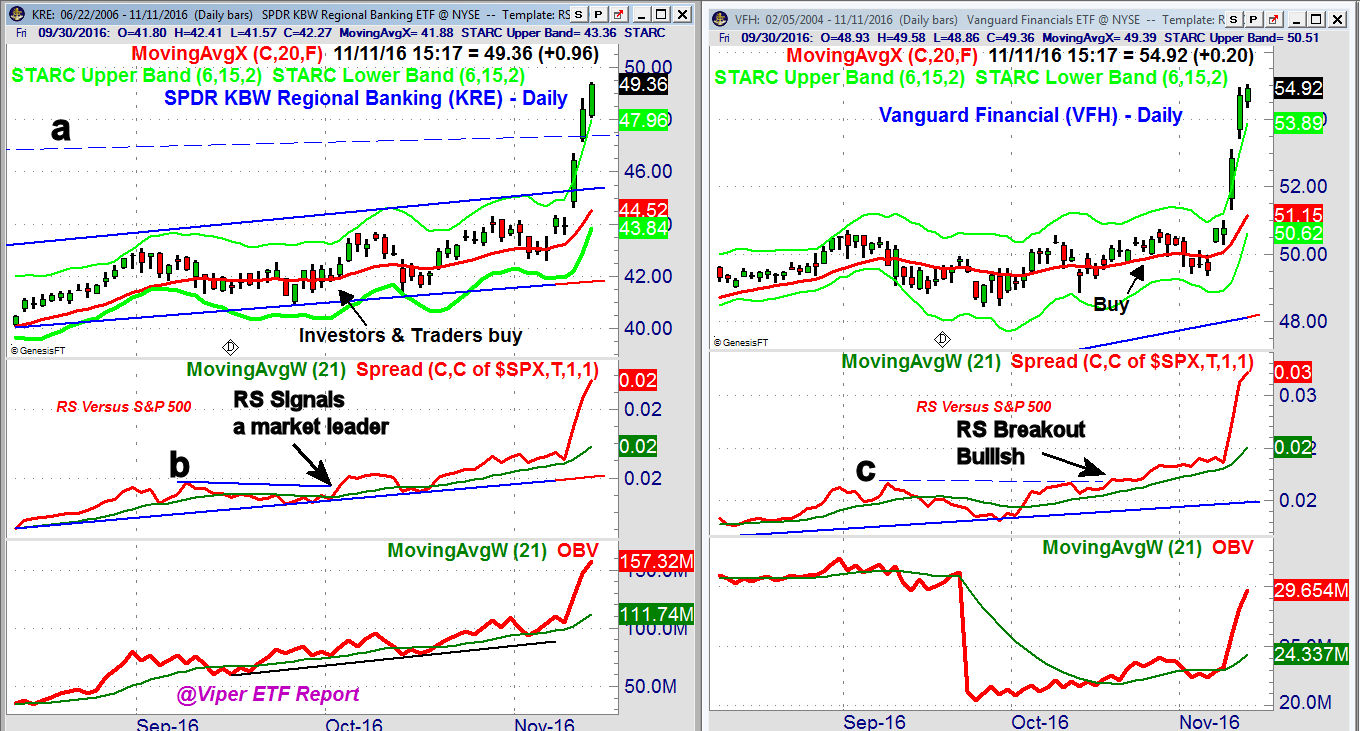
The powerful gains last week confirmed the bullish outlook for two ETFs that were recently recommended to Viper ETF clients. The SPDR KBW Regional Banking (KRE) was up 15% this week as the RS analysis turned positive in early October (line b) signaling it was a market leader. Both the RS and on-balance-volume (OBV) have surged higher and have confirmed the recent highs.
Vanguard Financial ETF (VFH) also rallied sharply this week from $49.52 to just above $55. The RS completed its bottom on October 19th as the resistance at line c, was surpassed. The daily OBV has been lagging but the weekly OBV is acting very strong.
Both of these ETFs as well as others are trading above their starc+ bands and this makes a pullback or some consolidation likely in the next week. There are several sectors that appear to be have bottomed and a pullback next week should be a buying opportunity.
The Economy
The main economic data last week was Consumer Sentiment as the mid-month reading rose to 91.6 which was up nicely from last month's reading of 87.2%.
The calendar this week starts with Retail Sales, Empire State manufacturing Survey and Business Inventories on Tuesday. This will be followed by the PPI, Industrials Production and the Housing Market Index.
On Thursday we have the Consumer Price Index, Housing Starts and the Philadelphia Business Outlook Survey. The week concludes with the Leading Indicators and the Kansas City Manufacturing Index.
Interest Rates & Commodities
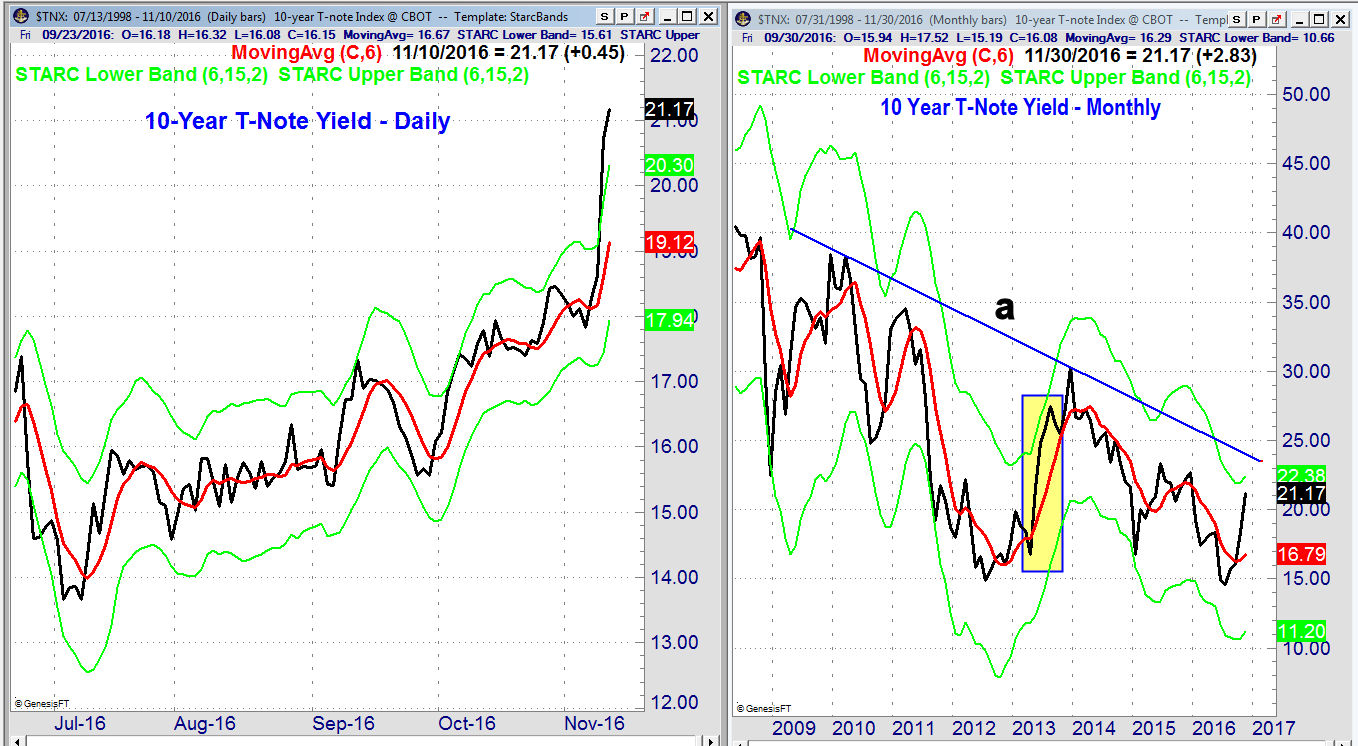
The rise in interest rates was even more dramatic than the stock market rally as the yield on the 10 -Year T-Note rose from 1.783% to 2.117%. The rally has been much stronger than I expected as I thought it would stall in the 1.90-2.00% area. Given this rise in yields a Fed rate rise in December appears to have already been approved by the bond market.
The yield has closed well above both the daily and weekly starc+ bands which is a sign that the rise in yields is likely to stall in the coming weeks. On the monthly yield chart I have highlighted the most recent sharp rise in yields that occurred in the summer of 2013.
In 2013 yields rose from 1.675 in April to a high of 3.026% in December 2013. The monthly chart shows next resistance in the 2.35% to 2.47% area and the long-term downtrend, line a. A pullback in yields to the 2.00% area would not be surprising before the end of the year.
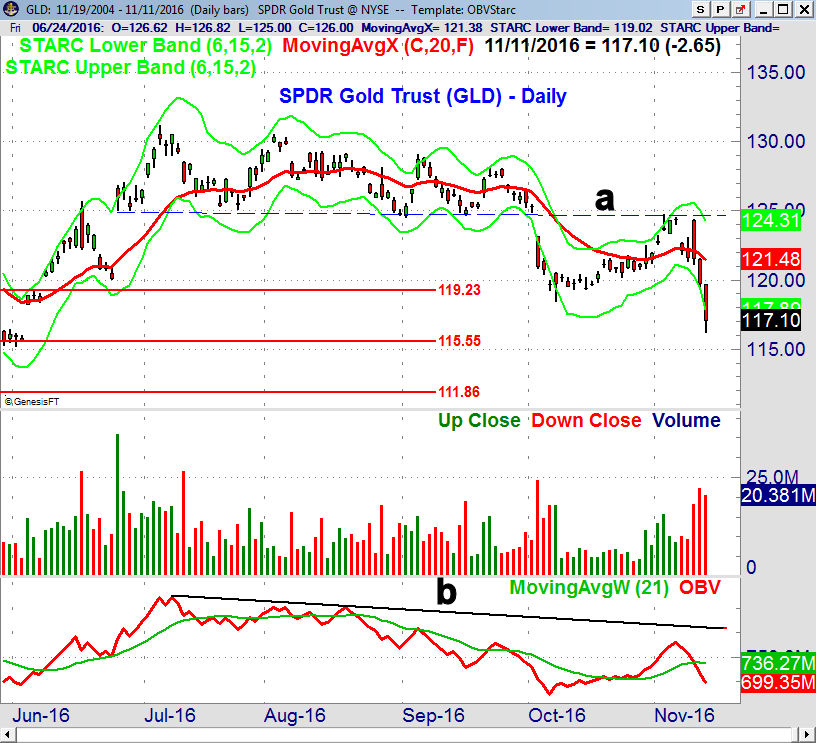
The gold market has gotten much attention recently as there are signs that inflation is picking up. The SPDR Gold Trust (GLD) rallied up to the resistance in the $125 area (line a) in early November before prices turned lower. Prices are now close to the 50% retracement support at $115.55 with the more important 61.8% support at $111.86.
Crude oil prices have remained under pressure and while the daily indicators are negative they have a chance to turn positive this week. This could be enough to complete the daily bottom formations in the energy ETFs.
Market Wrap
Even though the major averages posted impressive gains, 10.2% for the small cap Russell 2000 and 5.4% for the Dow Industrials the weekly A/D numbers were disappointing. There were 1781 advancing stocks and 1355 declining last week. It was another strong week for the Dow Transports as they gained 6.2% which was quite a bit better than the 3.8% gain in the S&P 500.
The financial stocks led the market higher gaining 7.8% and they were closely followed by a 7% gain in the industrial stocks. The Clinton defeat also spurred a sharp rally in the health care sector as it was up 6.1%.
According to AII the number of bullish investors surged last week to 38.9% a rise of 15.3%. Most of these came from the neutral camp as the bearish % dropped just 5% to 29.3%. The widely watched Fear & Greed Index which was at 14 last week (extreme fear) closed neutral at 48.
The daily advance/decline lines are not yet in agreement over the recent rally. The NYSE Composite closed back above its quarterly pivot as did the SPY, QQQ, DIA and IWM. This reversed the negative signals from the past few weeks.
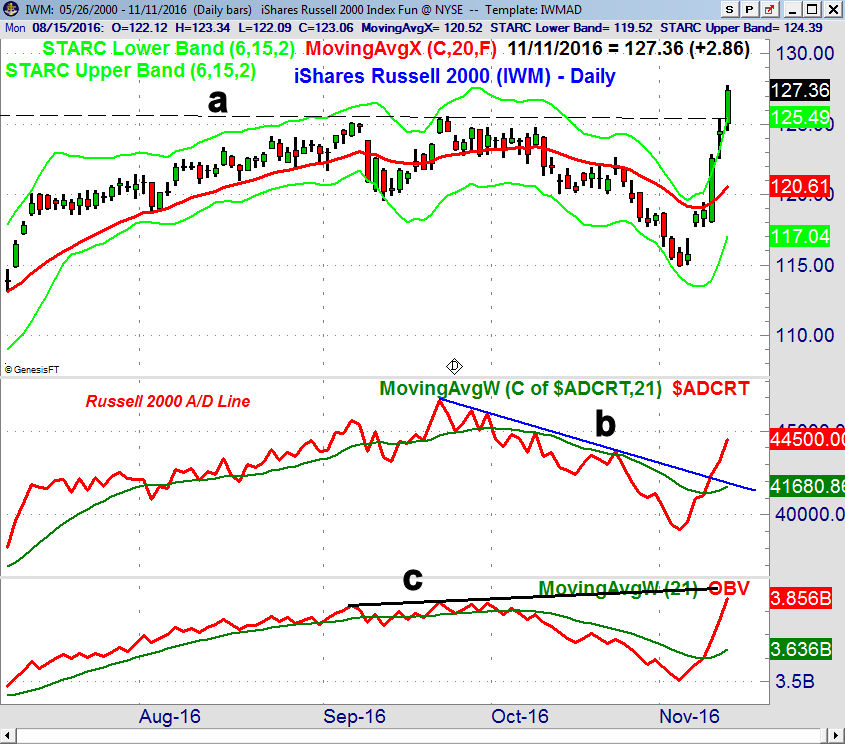
The A/D lines look the strongest on the iShares Russell 2000 (IWM) as it closed at new all time highs and well above the September highs, line a. The IWM closed well above its daily starc+ band with the weekly now at $128.27. There is quarterly pivot resistance at $129.29 and then $134.37. The rising 20 day EMA is at $120.61.
The daily Russell A/D line has surged above its downtrend, line b, and is now in an uptrend. The A/D line is still well below the September highs. The Russell 2000 A/D line is the only weekly A/D line that has moved above its WMA. The daily and weekly OBV are now both positive but neither has made a new high with prices.
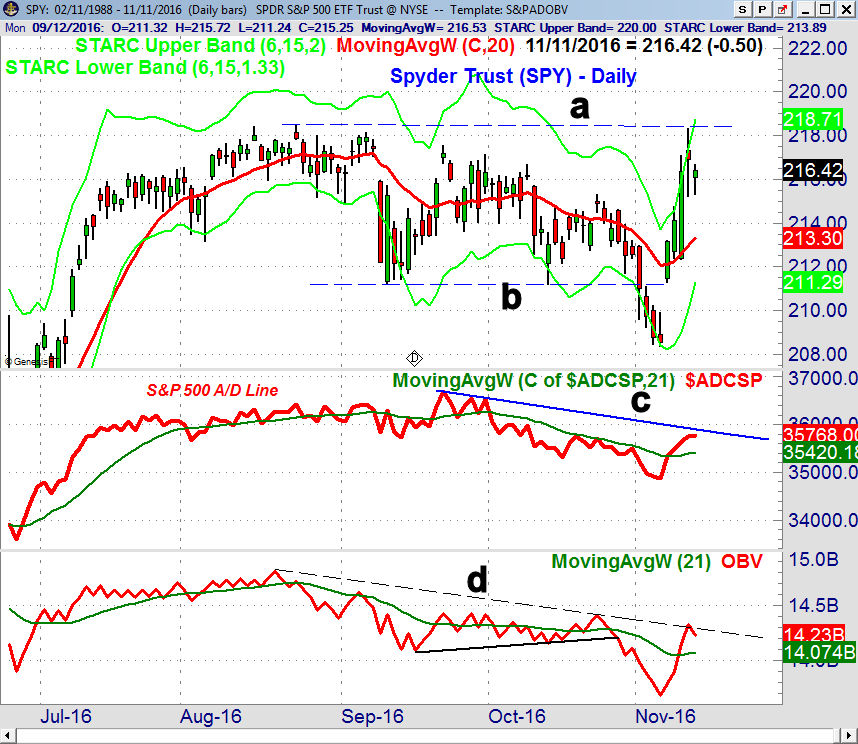
The Spyder Trust (SPY) approached the previous highs at $218.51, line a, but was unable to break through last week. There is initial support now at $214.32 and the quarterly pivot with the rising 20-day EMA at $213.30. The lower boundary of the recent trading range, line b, is now at $211.30.
The S&P 500 A/D line has moved well above its WMA but is still below the downtrend line c, which needs to be overcome to signal that the correction is over. The daily A/D line is above its WMA but the weekly is not. The daily OBV just reached its downtrend, line d. The weekly OBV (not shown) has reversed back above its WMA which is positive.
The big tech stocks declined last week as they were sold over concerns they would underperform in a Trump administration. They were also likely sold to raise cash to buy the financial and industrial stocks. I do not expect this to last as there are number of tech stocks that have shown up on the weekly Viper Hot Stocks buy list.
What to do? The sharper correction I thought was possible last week was over in just a few hours. It continues to be a tough market for those on the short side as only nimble futures traders were able to bank outstanding gains on the market's sharp drop. Viper ETF traders were stopped out of their positions in the Direxion Daily Small Cap (TZA) for over an 8% profit before the election. Those who had bought the ProShares UltraShort S&P500 (SDS) later were stopped out with a 0.8% loss.
The sharp drop in the bond market last week likely has some bond market investors worried and this is likely to continue as yields move even higher. The Vanguard Total Bond Market Index Adm (VBTLX) has over $161 billion in assets and it lost 2% last week. Other bond funds with a longer maturity likely did even worse and this could provide an unpleasant surprise in some year-end statements.
The daily technical studies have improved more quickly than I thought was possible. Even though all the A/D lines have not moved out of the corrective mode I think this is looking more likely. However as the market moves higher it will be important that the technical studies start to lead prices higher.
It does look as there will be some good trading opportunities in the last six weeks of the year in both ETFs and stocks.
Viper ETF clients are long a number of different sector ETFs and have open orders to by several on a pullback which could occur this week.
The Viper Hot Stocks Report recommends both long and short stock positions based on the weekly scans as well as the monthly indicators. There were a large number of new buy signals after last week so I will be looking to cover remaining short positions and add more long positions.
Each service is only $34.95 per month and includes regular trading lessons as well as the twice a week reports. New subscribers receive four of the most recent trading lesson and subscriptions can be cancelled anytime on line.
Comments
comments