

The earnings season got started with a bang last week as Netflix (NFXL) reported a 36.5% increase in year-over-year revenues and added 3.6 million subscribers. After closing Monday at $99.80 it opened Tuesday at $116.63 and continued to move higher all week closing at $127.50
The big banks also beat Wall Street's expectations as strong trading revenue boosted stocks in Goldman Sachs (GS), Bank of America (BA), JP Morgan Chase (JPM) and Citigroup (C). For several years market skeptics have argued that the market could not go up without the financial stocks but this may now be removed from the wall of worry.
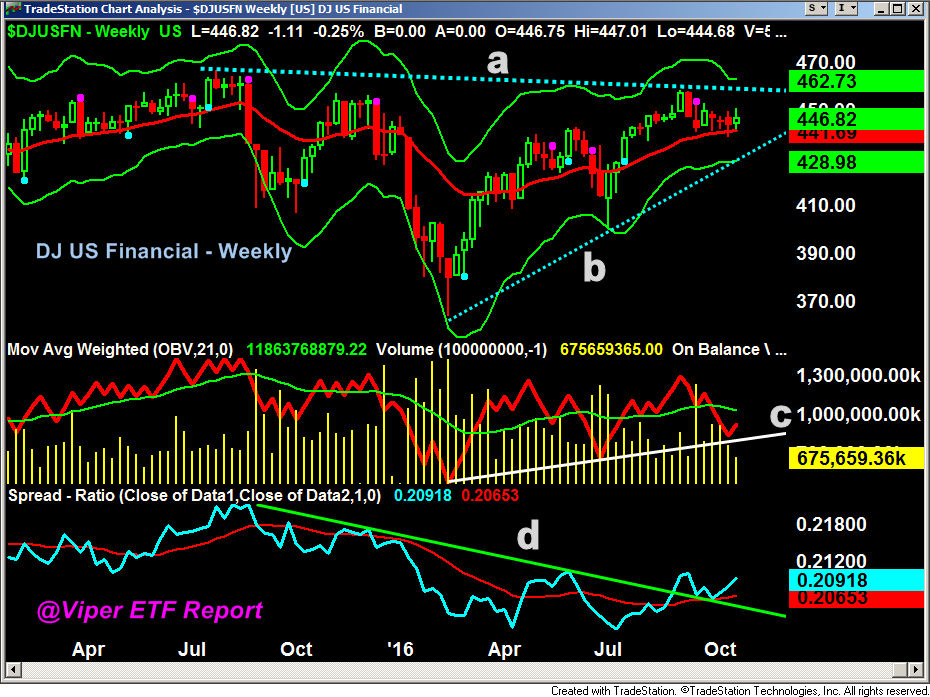
The chart of the DJ US Financial Sector (DJUSFN) shows that it has been holding above the 20 week EMA for the past month. A weekly close above the resistance at 460, line a, would be a significant upside breakout and signal a move to the 500 area.
The weekly OBV has turned up from support at line c, but is still below its WMA. The weekly relative performance broke its downtrend (line d) in August and then pulled back to its WMA. The way the RS line has turned up from its WMA consistent with a market leader.
Viper ETF subscribers are already long the SPDR S&P Regional Banking ETF (KRE) and will look to be a more aggressive buyer in the financial sector once the A/D lines move out of the corrective mode.
Many Wall Street strategists are not looking for stocks to move higher through the end of the year (Yearly Forecasts - Fact or Fiction) and the recent high cash level of fund manager's also suggests a high level of bearishness.
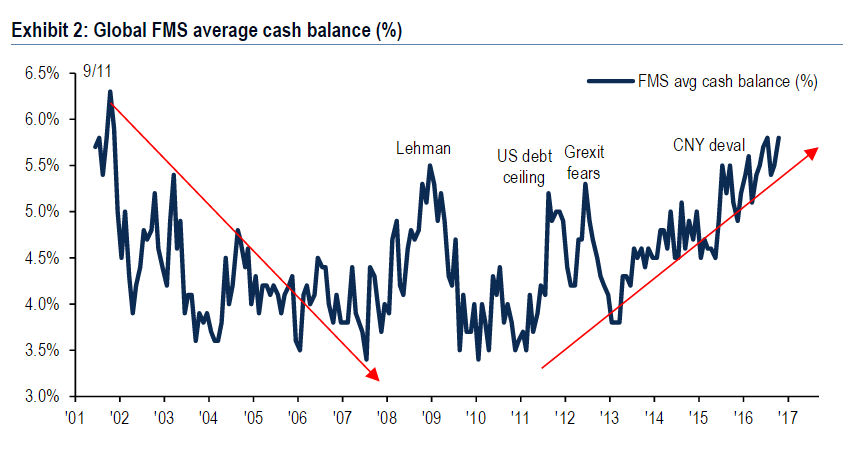
According to Bloomberg the BofA Merrill Lynch October Fund Manager Survey the cash levels are the highest since November 2001 . According to Michael Hartnett, chief investment strategist at BofA, “This month’s cash levels indicate that investors are bearish, with fears of an EU breakup, a bond crash and Republicans winning the White House jangling nerves."
The chart shows that the cash levels have been rising for several years. At the market high in 2007 the cash levels were below 3.5%. At the correction lows in 2010 and 2011 the cash levels were also low which did not allow for aggressive buying by fund managers at low prices.
Last week's AAII survey reveals the individual investor is also not bullish as the % dropped 1.7% to 23.7%. The bearish % rose 4.1% to 37.8%. At important lows the bullish % can drop below 20% and we are not far away from these levels.
The financial media has been focused lately on what stocks may or may not do well whether Clinton or Trump wins. I think this may already be factored into stock prices but the fears could cause further selling in the weeks ahead.
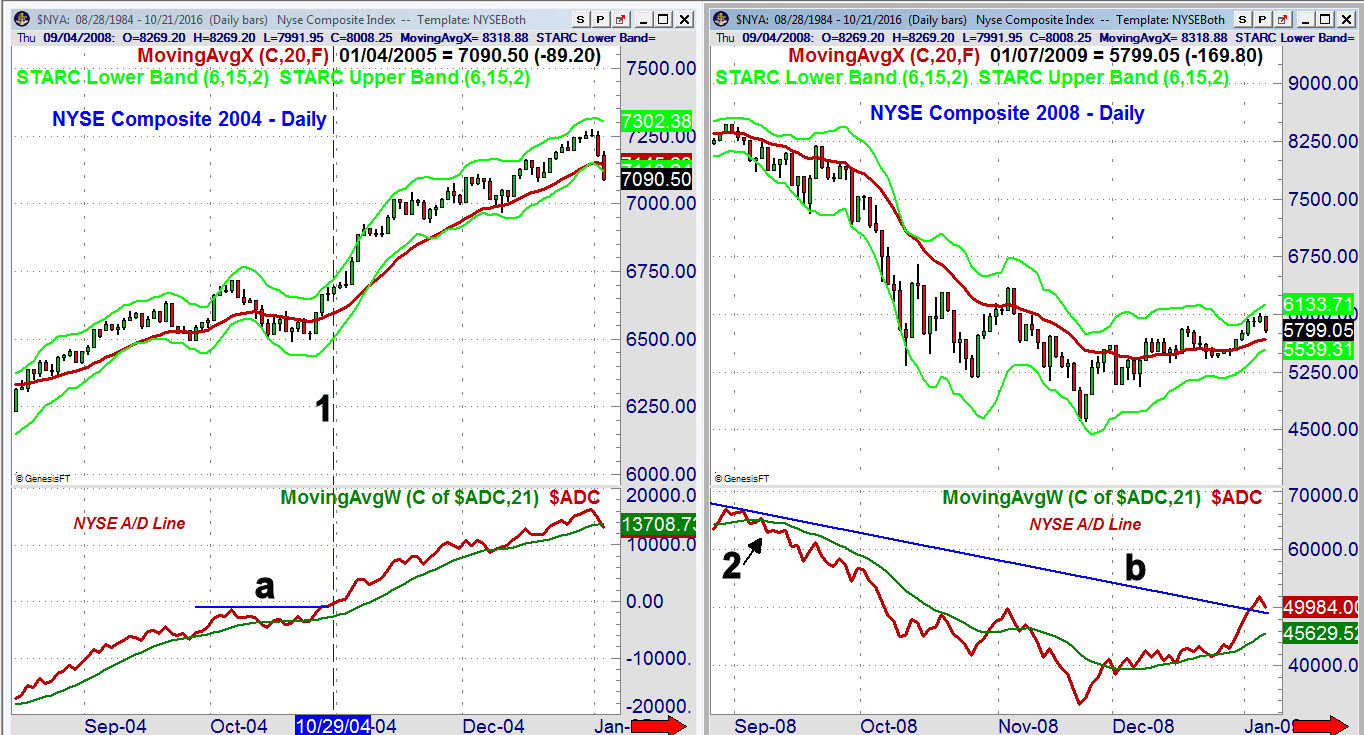
But what did the technical studies look like in the last quarter of the past three election years? In 2004 the NYSE Composite gained 10.3% in the 4th quarter. The NYSE A/D line (One Indicator Stock Traders Must Follow) moved above and below its WMA in October 2004 before breaking out to the upside on October 29th (line 1). The NYSE A/D line was in the acceleration mode until early December as the NYSE Composite gained 6%.
In 2008 the NYSE A/D line resumed its downtrend on September 8th as it had completed a daily top in June as the A/D lines had been diverging from prices over the past year, consistent with a bear market. The A/D line made new lows in October before rebounding into Election Day before it again began to drop.
The NYSE A/D line made another new low was made in November and even though the NYSE did rebound late in the year it was still down 23.5 % in the last quarter of 2008. The weekly A/D line did not complete its bottom until the spring of 2009.
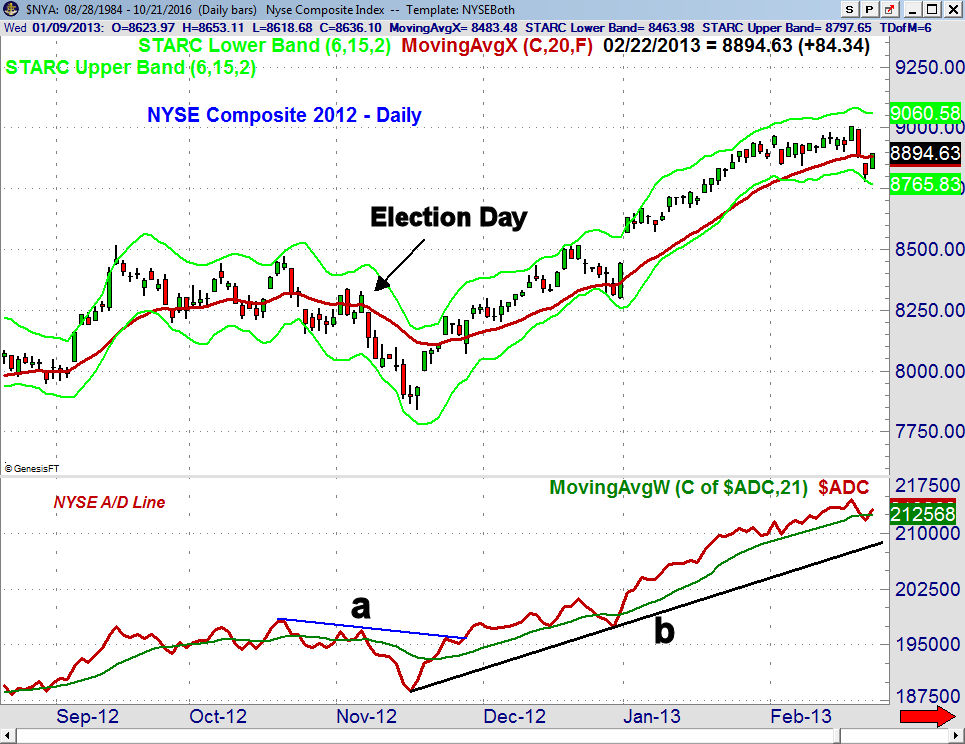
In 2012, the NYSE Composite was in a trading range for six weeks between mid-September and Election Day on November 6th. The day after the election the NYSE started dropping as it lost 5.6% in just 8 trading days.
Just seven days after the market's low the A/D line moved through its downtrend (line a) as it had earlier moved back above its WMA. The A/D held above its WMA until late in the year when the market dropped over concerns about the fiscal cliff. By the start of 2013 the A/D line had made another new high.
In the 4th quarter of 2012 the NYSE Composite gained 2.3% but from the November 16th lows it was up 7.6%. Of course 2013 was the best year of the bull market as the Spyder Trust (SPY) was up 32.3%. The current market looks the most like 2012 in my opinion but that does not mean we have to see a post election drop before stocks can move higher. As discussed in the Market Wrap section the first step should be a turn in the A/D lines.
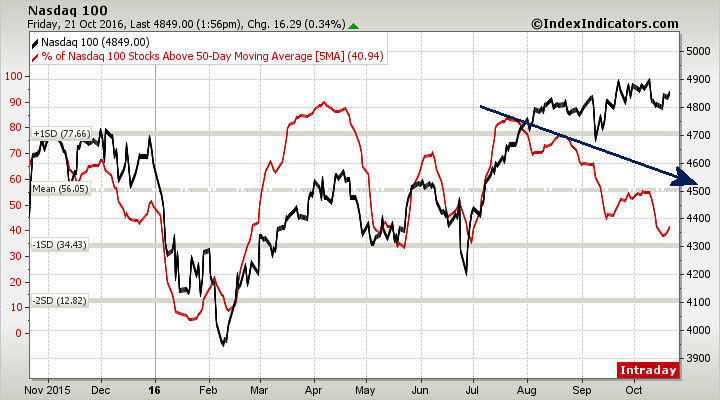
One tool I use to evaluate whether the market is overbought or oversold is to look at the 5 day MA of the number of stocks in a market average that are below or above their 50 day moving averages. This chart looks at the status of the Nasdaq 100 as the moving average (red line) turned up last week after dropping almost to one standard deviation below the mean at 56%. A move back above the mean and the downtrend, line a, would be positive.
The same analysis on the S&P 500 suggests it is even more oversold as its MA has turned up from below 30%. The current reading at 31% is well below the mean at 56% so once the market bottoms out there should be plenty of attractive stock picks.
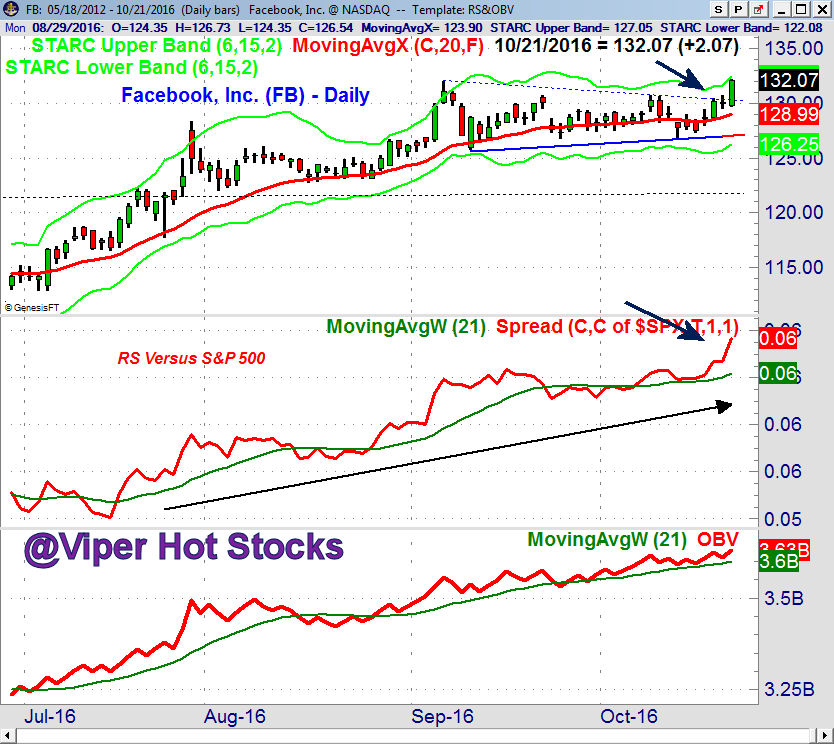
I will be looking for stocks like Facebook, Inc. (FB) which has been a market leader since mid-July when original longs were established by Viper Hot Stock traders. As the market was drifting lower last week, FB staged a breakout of its trading range (lines a and b). The daily RS line has soared confirming it was a market leader. The weekly and daily OBV are also positive.
The Economy
The week started off on a sour note as the Empire State Manufacturing Survey came in at -6.8 which is the third negative monthly reading in a row. The Industrial Production was flat at 0.1%. Consumer prices rose the expected 0.3% in September and remember a bit higher inflation can be positive for the economy. The Housing Market Index on Tuesday was strong at 63.
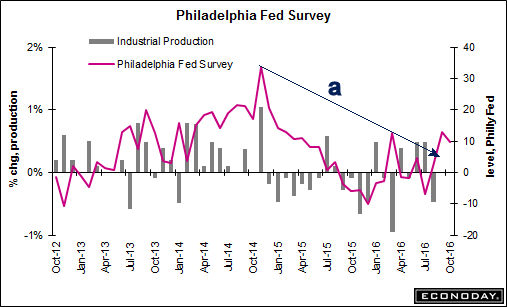
Housing Starts Wednesday were pretty much unchanged while the next day's Existing Home Sales surged 3.2% in September. The Philadelphia Fed Survey on Thursday was better than expected at 9.7 which appears to break the downtrend, line a. Further strength in the next few months is needed to support the view that the economy is improving.
The Leading Economic Index rose 0.2% in September which reversed the decline in August. It continues to demonstrate that there is no recession on the horizon.
There is a full economic calendar this week with the Chicago National Activity Index Monday along with the flash reading on the PMI Manufacturing Index. The S&P Corelogic Case-Shillar Housing Price Index is out on Tuesday, Consumer Confidence and the Richmond Fed Manufacturing Index.
The flash reading on the PMI Services Index comes out on Wednesday and New Home Sales followed by Durable goods along with the Pending Home Sales Index on Thursday. On Friday we get the advance reading on the 3rd quarter GDP, Employment Cost Index and Consumer Sentiment.
Interest Rates & Commodities
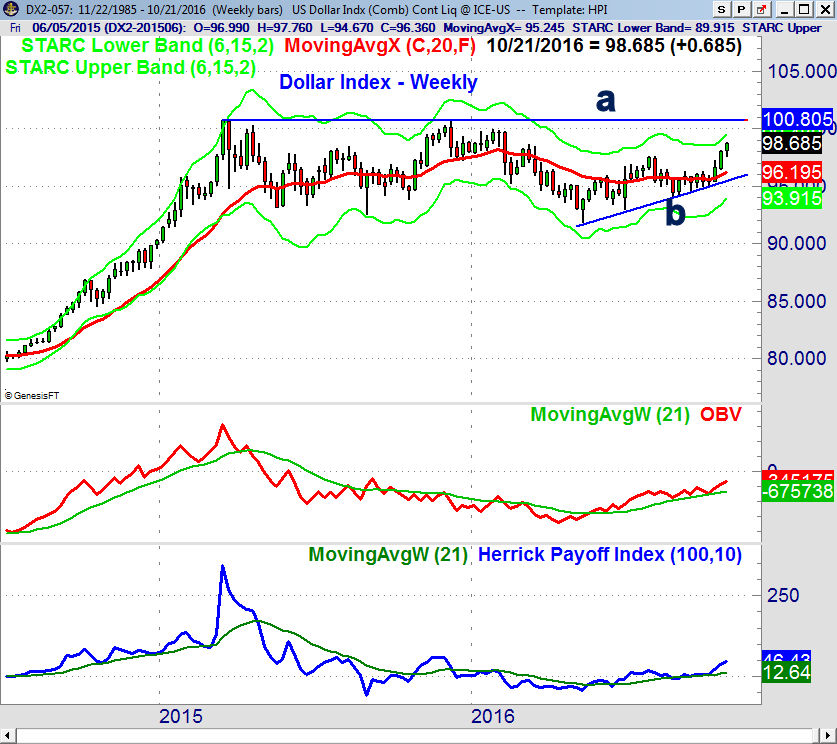
The focus of the commodity markets and interest rates last week was on the dollar as it had its third strong week in a row. The chart of the dollar index shows a solid uptrend (line b) with the starc+ band now at 99.48.
There is long-term resistance going back to 2015 at 100.85, line a. This is 2.2% above current levels as the dollar index has gained almost 5% from the August lows. The OBV and HPI are both positive but the OBV is now as strong as it was in 2014 and is well below the 2015 high.
The sharp rally in crude oil prices has once again caught many money managers on the wrong side as they have been forced to cover their short positions. For the December contract there is strong resistance in the $52 area with the 20-day EMA at $49.86. The intermediate trend is still looking strong though a pullback would not be surprising. In addition to the SPDR Oil & Gas Exploration (XOP) there are several other energy ETFs that now look interesting.
Gold prices have tried to stabilize despite the stronger dollar. Both the weekly and daily technical indicators are negative and show no signs yet of a bottom.
Market Wrap
There were minor changes in the major averages last week as the selling was counteracted by strong earnings from companies like American Express (AXP) and Microsoft (MSFT). The Dow industrials were up 0.04% while the S&P 500 gained 0.38% and the Dow Utilities continued to rebound up 0.49%.
More significant was the 0.86% gain in the PowerShares QQQ Trust (QQQ) which tracks the Nasdaq 100 and the 0.47% higher close in the small cap Russell 2000. The weekly advance/decline numbers were positive with 1968 up and 1151 down. This reverses the negative readings of the past two weeks.
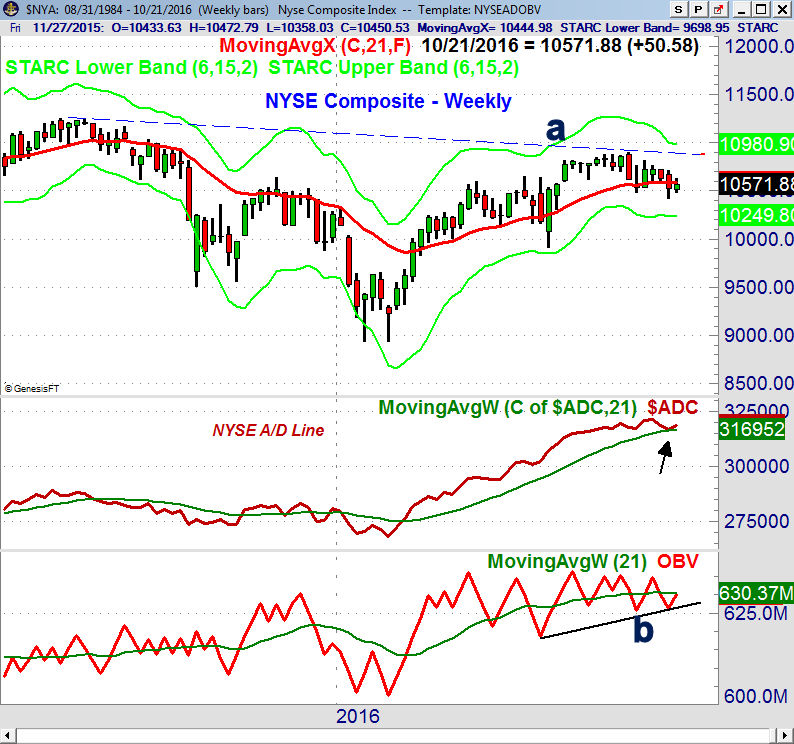
The range in the NYSE Composite last week was tight with short term resistance now at last Thursday's high of 10,626 with more important in the 10,750-800 area. There is major resistance at 10,900, line a, with the weekly starc+ band at 10,980. The support from the prior week at 10,425 is now more important.
The weekly advance/decline line has bounced from its WMA and a positive close this week will strongly suggest that the correction is over. The A/D line made a new high in September. The weekly OBV has turned up from support at line b but is still below its WMA.
The daily and weekly S&P 500 A/D line are still below their WMA but the PowerShares QQQ Trust (QQQ) is acting much better. On a move above the recent high at $119.48 the weekly starc+ band is at $122.85. The rising 20-week EMA is at $114.74 with the September low at $113.35 (line a) now represents even more important support.
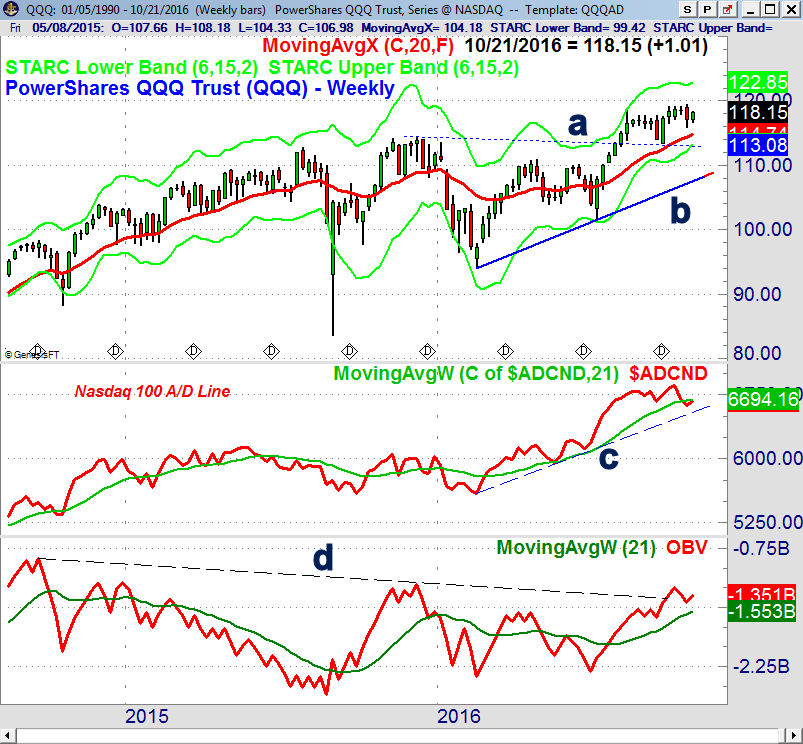
The weekly Nasdaq 100 A/D line has turned up but is still barely below its WMA. The A/D line has further support now at line c. The weekly on-balance-volume (OBV) looks even stronger as it moved through the long term downtrend, line d, on September 23rd and turned up last week.
The iShares Russell 2000 (IWM) dropped down to test the $120 level but then closed near the day's high. This means a strong close above the $125.53 area would project a move to the $130 area.
What to do? The market has been very resilient in the past week and the action in the technology stocks has been especially impressive. The higher weekly close as I noted last time does suggest that the worst of the selling may be over.
A day of very strong A/D numbers this week and the absence of any heavy selling could move the daily studies back to neutral. Several strong days could turn the analysis positive. By Election Day the A/D lines could move into the strongly trending mode when would warrant more aggressive buying like in the spring.
Those who are not in the stock market should look to one of the broadly diversified ETFs that have low fees. If we do see another 1% daily drop in the major averages it should be a buying opportunity. It would take a daily close in the S&P 500 below 2126 to trigger more aggressive selling that could take it below 2100.
As I noted earlier the charts of 2012 seem to be the most similar to the current situation which means that stocks could rally sharply into year-end. This could take the S&P 500 well above the 2200 area. Viper ETF investors are long the market tracking ETFs as well as some sector ETFs. We will likely be adding new trading positions this week.
There are an equal number of new buys and sells in from my weekly scan of the Nasdaq 100 and IBD Top 50 stocks after Friday's close. New short positions were added last week but with last week's action I will be looking for new market leaders, like Facebook (FB) to recommend to Viper Hot Stocks traders on Monday.
Comments
comments