

Just after noon on Friday it seemed as though stocks were going to finish the week slightly lower for the week but then the news from the FBI regarding new emails rocked the market. The S&P futures dropped 20 points in just over an hour. Though the market recouped much of these losses the tone of the market definitely changed.
Investors are wondering whether the start of the new month will mark the start of a new more friendly market or whether the end of October is setting the stage for more investor pain. In last week's column I looked at the last three-election year markets (Market Insights From Past Election Years) and concluded that the price action was the most similar to 2012 when there was a sharp post election decline.
Let's look at some of the positive and negative factors that are likely to impact stocks for the last two months of the year.
The Positives
According to the Investopedia Sell in May and Go Away "Since 1950, the Dow Jones Industrial Average has had an average return of only 0.3% during the May-October period, compared with an average gain of 7.5% during the November-April period."
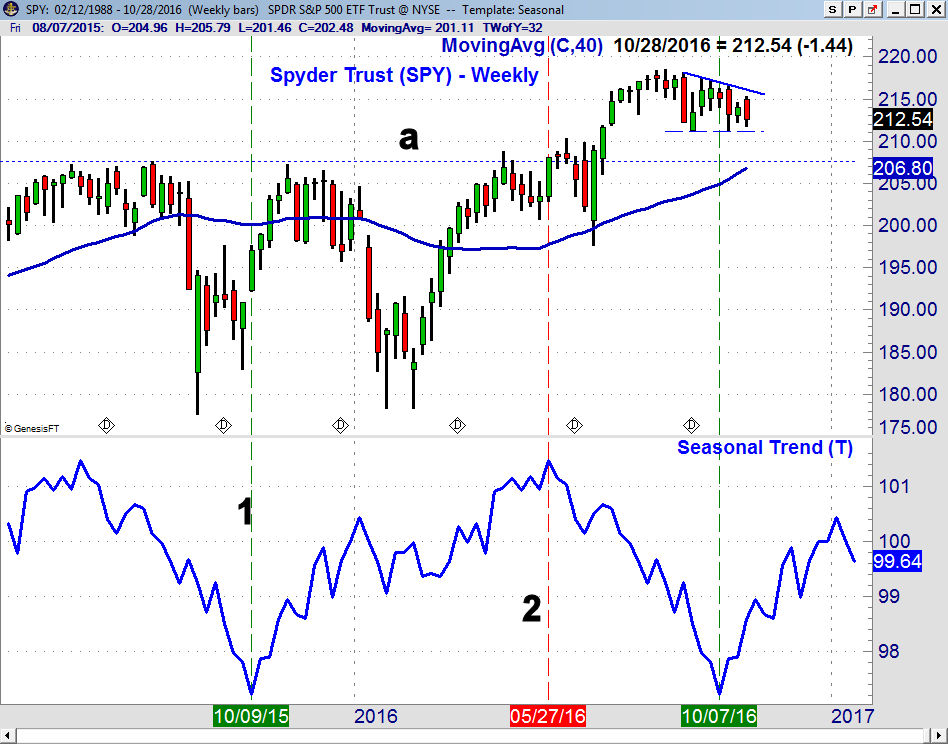
Looking at the seasonal pattern for the Spyder Trust (SPY) going back to 1988 reveals that it typically bottoms in early October (line 1) and tops in late May (line 2). The weekly chart shows a short-term flag formation that requires a weekly close above $216.70 for an upside breakout and a close below $211.24 for a downside break. The weekly chart shows major support line a, is at $207.60 with the rising 40 week MA at $206.80.
The bullish sentiment for the stock market is still quite low with just 24.8% bullish according to the AAII survey of independent investors. The level of bullishness is close to levels normally seen at market lows.
As I noted at the February lows (Is There Blood In The Streets Yet?) "According to AAII the bullish% dropped 8.3% in the latest survey to 19.2% bullish just above the 17.9% reading from mid-January ." At the bear market low on March 5, 2009 only 18.9% were bullish.
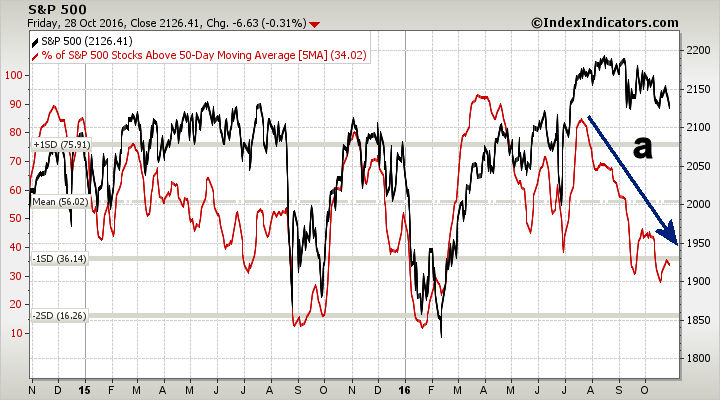
The analysis of the number of the S&P 500 stocks above their 50-day MA shows that the 5 day MA is at 34% which is well below the mean at 56%. The trend of the MA is still down, line a and at the October 2015 and January lows the MA stropped below 16%. These low levels when accompanied by bullish signals from the market internals created low risk buy signals for Viper ETF subscribers.
The surprisingly strong advance reading of 2.9 for 3rd quarter GDP is an encouraging sign and is consistent with the improvement in some of the other economic data. The manufacturing sector could still do either way and needs to see significant improvement in the coming months.
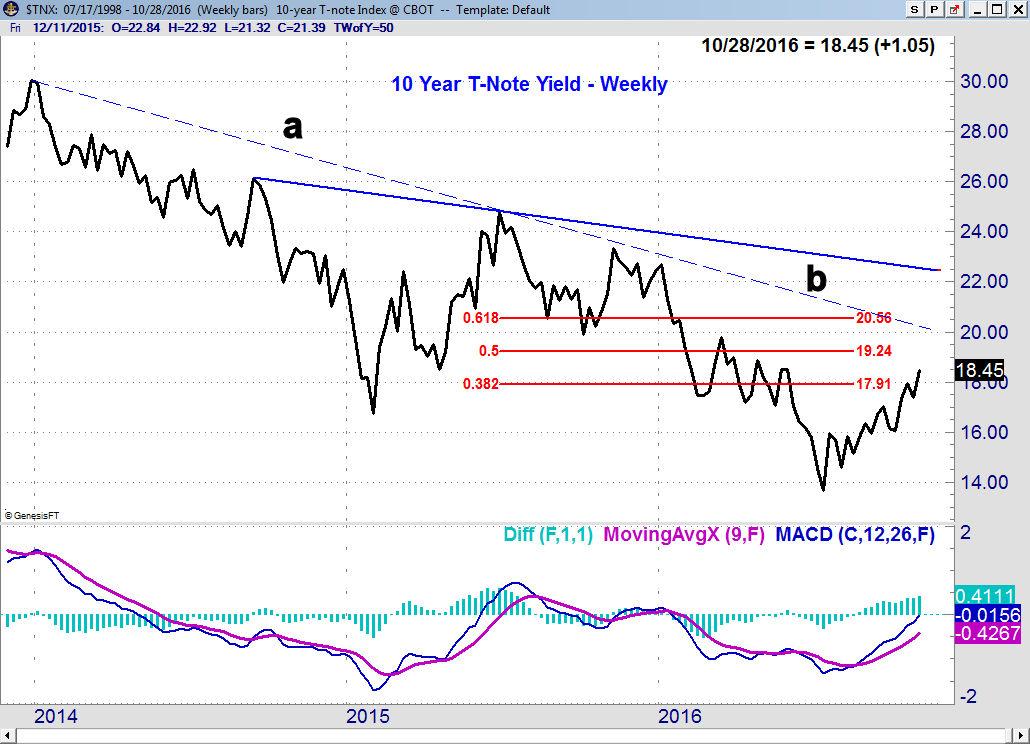
The strengthening economy is consistent with the sharp rise in yields from the July lows. The 38.2% resistance at 1.791% from the June 2015 high at 2.489% has been overcome. The 50% resistance is at 1.924% with the downtrend (line a) and the 61.8% resistance at 2.056%. There is additional resistance from the 2014 and 2015 highs, line b, at 2.258%.
This earnings season so far has been better than forecast which is what I have been expecting since the summer months. A positive earnings quarter should help encourage more investors that stocks are worth the risk.
Though many investors fear higher rates there is clear evidence that gradually rising rates are good for stocks. The weekly MACD is rising and has moved further into positive territory with no signs yet of topping out. The daily MACD does show a loss of upside momentum. As money moves out of the dropping bond market some of the money should move into stocks.
The recent demand of inflation-protected bonds suggests that many are now more worried about the potential for higher inflation. A gradual increase in the very low inflation rate does allow employers to pay more as companies can charge more for their goods. Low and rising inflation is also typically a positive for the stock market.
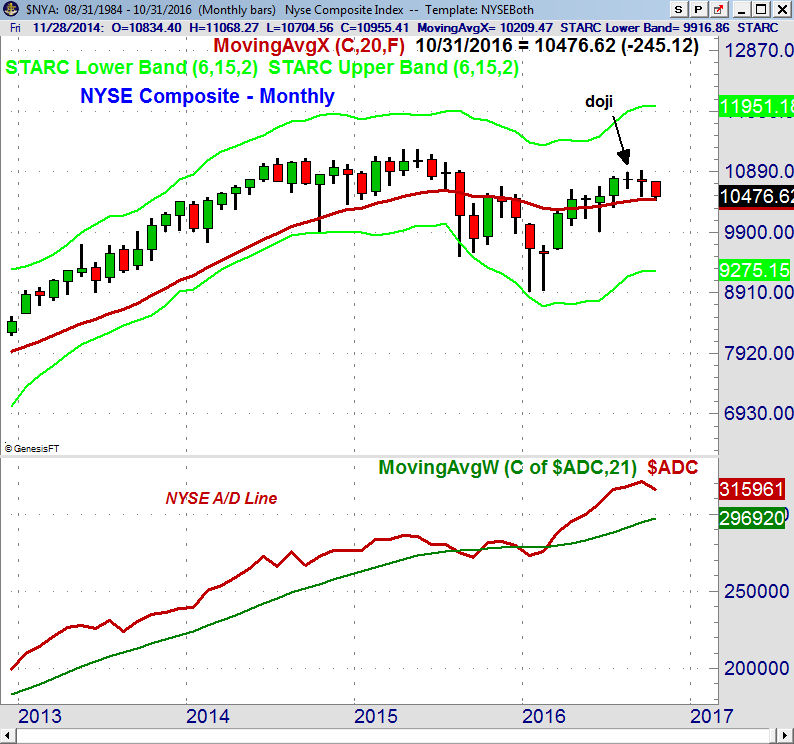
The monthly chart of the NYSE and the NYSE A/D line (One Indicator Stock Traders Must Follow) has both positive and negative indications for the months ahead. The monthly A/D line made a new high in September and looks ready to turn lower this month. It is still well above its rising WMA. In 2007 the monthly A/D line peaked in May and then diverged from prices as the major averages were making their highs. It is also a positive that the weekly A/D line has also not formed any bearish divergences.
The Negatives
The monthly chart of the NYSE Composite shows that it formed a doji in August and a close Monday under 10,619 (the doji low) will trigger a doji sell signal. The last doji sell signal occurred in June 2015 as stocks did not drop sharply until August.
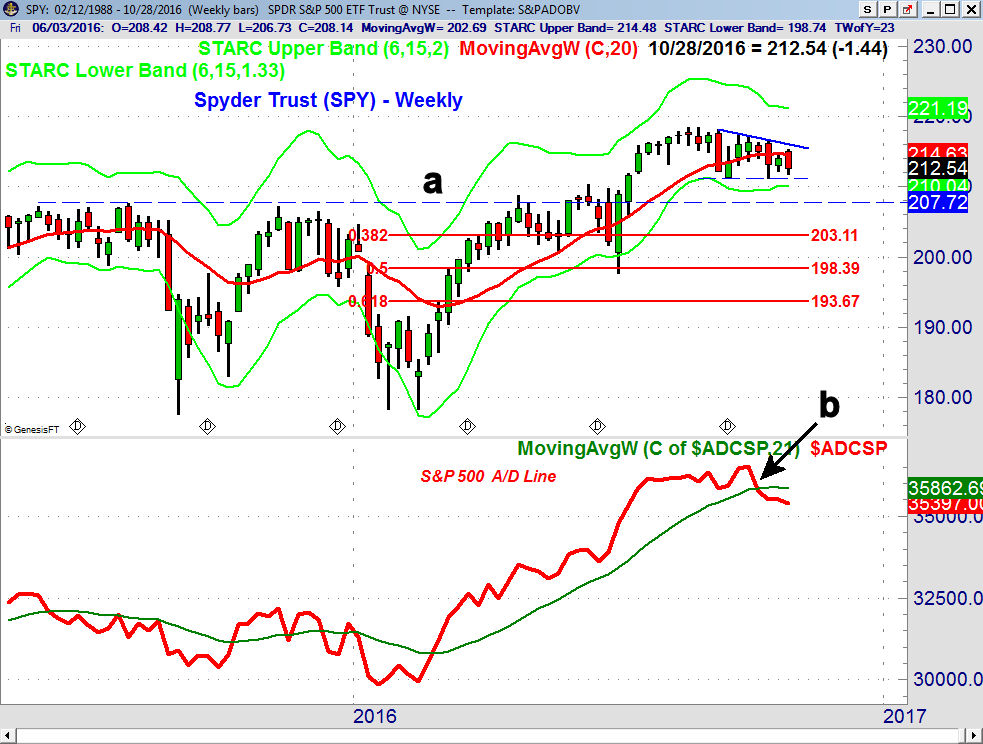
The weekly chart of Spyder Trust (SPY) shows an eight-week flag formation and a close below $211.21 would project a move to the $204-$206 area. There is quarterly pivot support at $209.04 and a band of weekly support, line a, in the $207.72 area. The 38.2% Fibonacci retracement support from the January 2016 low is at $203.11 which is 4.4% below Friday's close.
The weekly Nasdaq 100 A/D lines and Russell 2000 A/D lines are also now below their WMAs. The weekly relative performance analysis indicates that the Nasdaq 100 is still leading the market higher and therefore on a deeper correction it should not correct as much as the S&P 500.
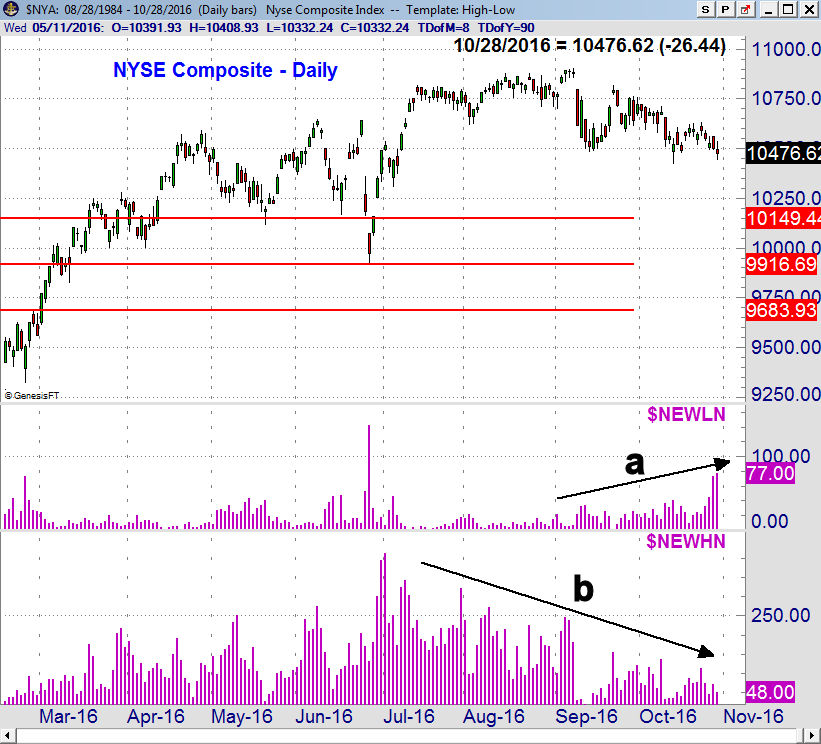
The 38.2% support for the NYSE Composite is at 10,149 with the more important 50% support at 9916. The most recent peak in the number of NYSE stocks making new highs was in June and has since formed lower highs, line b.
A contraction of new highs is not always a negative sign unless it is accompanied by an increase in new lows which just started to turn higher last Thursday and Friday. If this trend continues it will be consistent with a further market drop.
The development of divergences between the number of new lows and new highs is more effective at market bottoms as I pointed out at the February lows (see chart). This coincided with bullish signals from the market internals that set up some good buying opportunities for Viper Hot Stock traders.
Crude oil has been under pressure for the past eight days as the December crude is now close to the 38.2% support at $48.13. There is more important support in the $45.62-$46.87 area. The weekly indicators have turned down but the OBV confirmed prices and is well above its rising WMA. The HPI has not yet made new yearly highs but is positive and still above its support. The daily studies on crude oil are negative do allow for a further correction. A more serious decline in crude oil could put additional pressure on the stock market.
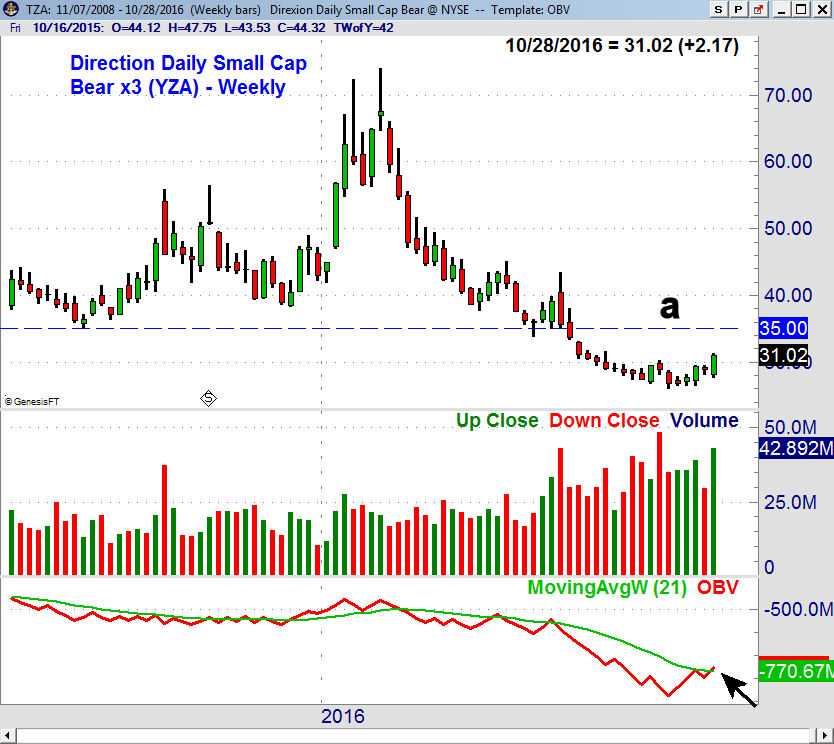
The daily analysis on many of the inverse ETFs has turned positive with last week's action. The weekly chart of Direxion Daily Small Cap Bear (TZA) shows that there is major resistance in the $35 area. It was recommended to aggressive Viper ETF traders initially on October 12th. Traders closed out half the position late last week for a 8.8% profit.
The weekly OBV on TZA has just moved above its WMA but does not show a major bottom formation. The daily OBV does look much stronger and shows no signs yet of topping out. For short-term traders I will be looking for new entry points in other inverse ETFs on a market bounce.
The bullish daily action in the inverse ETFs is also a negative for the overall market. There are still a number of ETFs that are outperforming the market as the financial sector is still clearly a market leader. On a deeper correction it is the relative performance analysis that will identify which sector ETFs are likely to be the best buys once the market tops out.
What to do? The failure of the market to continue higher for two weeks in a row has kept the daily A/D lines in the corrective mode. This is a sign that the market correction is likely not over and that stronger support is likely to be tested. It would take several days of very strong market internals to reverse last week's deterioration.
This means that Halloween is more likely to be a Trick than a Treat as the odds of a sharper correction in November are now higher. There are no signs of a major top or the start of a new bear market so this means a deeper correction should still be a buying opportunity. It would now take a move to new highs before weekly bearish divergences could form.
Over the near term a more defensive posture is warranted but a drop to the 2080-2100 area in the S&P 500 should be a good buying opportunity for those not in the stock market. On a sharp 1% decline I still favor a low fee, broadly diversified ETF.
There are still a number a market leading stocks like Facebook (FB) and Vantiv Inc. (VNTV) that Viper Hot Stocks traders are holding on the long side. There are an equal number of new buy and sells in this week's scan but I will be focusing on new short positions.
Comments
comments