

Most who are involved in the financial markets are happy that 2016 is finally over. It is been a year that has demonstrated the difficulty of predicting markets and politics based on traditional methods of analysis that are not based on hard market data.
It was a year where the limitations of political polling became evident to all and also a year when the conventional methods of political campaigning likely changed forever. The markets big hit at the start of the year turned many fundamentalists bearish on the economy and stocks. The 5% decline in the S&P 500 in January had many convinced stocks had to be lower for the year.
The fundamental data on the US economy has also been mixed for most of the year as while the jobs growth was generally positive, the growth in the manufacturing sector has been sluggish until later in the year. Clearly based on the Leading Economic Indicators, there has not been even a hint of a recession but there also have not been uniform signs of robust economic growth.
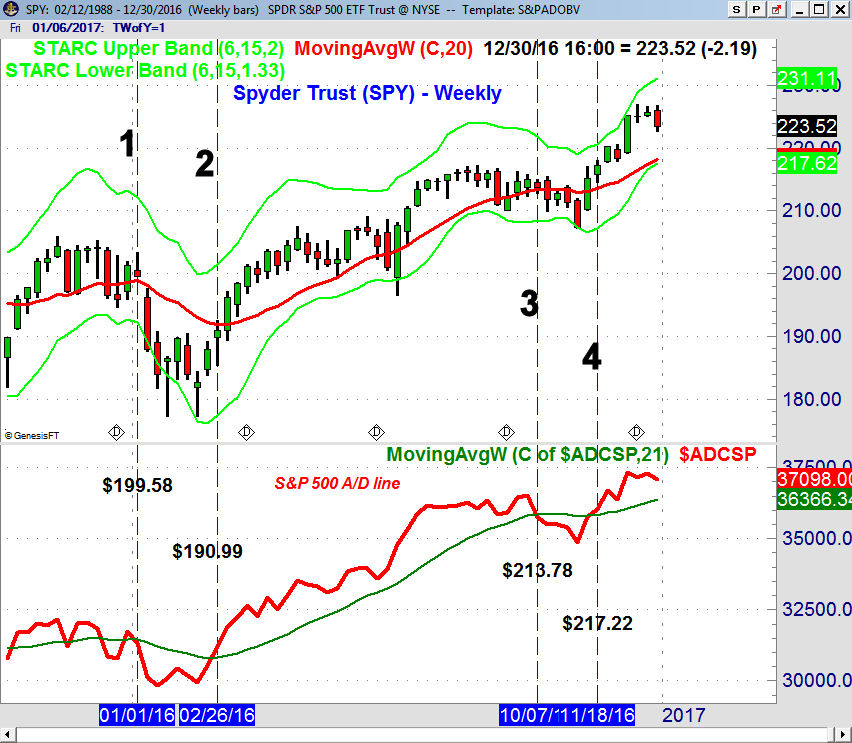
That is why I have always focused on the hard market data, like the monthly, weekly and daily advance/decline data. The weekly chart of the Spyder Trust (SPY) reveals that the weekly S&P 500 A/D line crossed its WMA four times in 2016. It dropped below it on December 31st, 2015 when the SPY closed at $199.58, line 1.
The weekly A/D line stayed below its WMA for most of the next two months as it crossed back above it on February 26th (line 2) as the SPY closed at $190.99. Two weeks earlier (Is There Blood In The Streets Yet?) I pointed out that the sentiment as well as many technical methods were pointing to a market bottom.
The positive signal stayed in force until October 7th (line 2) as the SPY closed at $213.78. The weekly S&P A/D line reversed to positive in the 2nd week of the post election rally on November 18th as the SPY is now 3.6% higher. Even though the SPY triggered a weekly doji sell signal with the close on December 30th a decline back to the A/D lines rising WMA should be a buying opportunity.
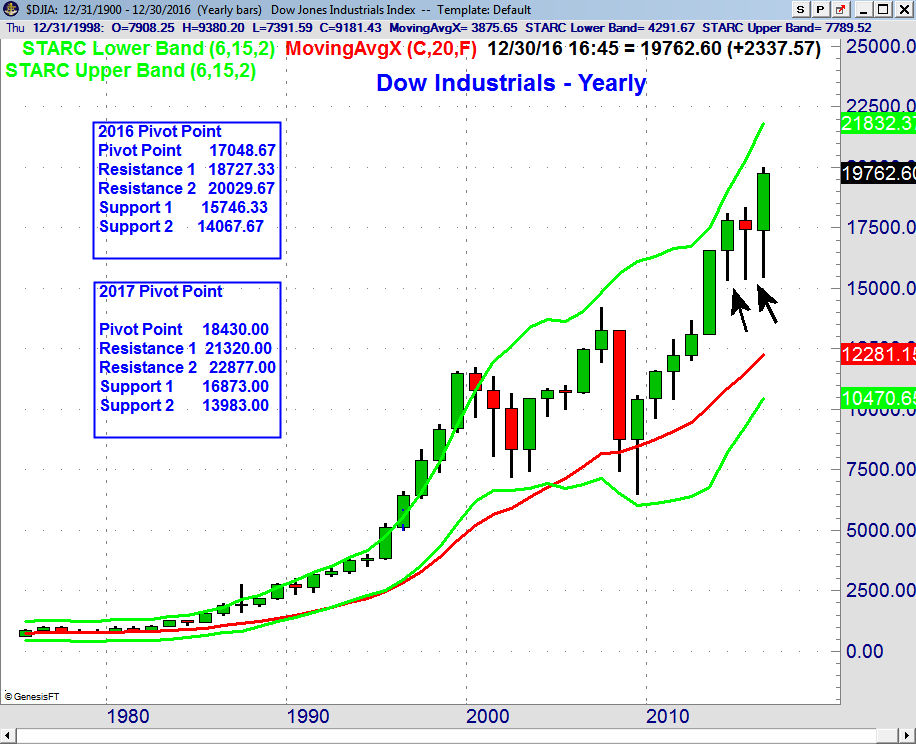
The yearly chart of the Dow Industrials shows that is closed up 2337 points for the year. The lows for the past three years (see arrows) have been 15,340, 15,370 and 15,450 as the long tails on the candle formations confirmed good demand at these levels.
The year pivot price projections, based on the yearly ranges in 2015, show that the S1 support was at 15,746. Even more interesting is the R2 resistance which was at 20,029. For 2017 the R1 resistance is at 21,320.
In my December 17th column I pointed out that "the weekly chart of the Dow Industrials shows that the trading range, lines b and c, was completed in July. Using the width of this trading range one obtains an upside target for the Dow at 21,332, line a."
The R2 resistance is at 22,887 which is 15.8% above the 2016 close. The yearly pivot at 18,430 is 6.7% below the close while the S1 support at 16,873 is 14.6% lower. These levels should be monitored as the year progresses and in the New Year I will review the yearly pivot levels for other key markets.
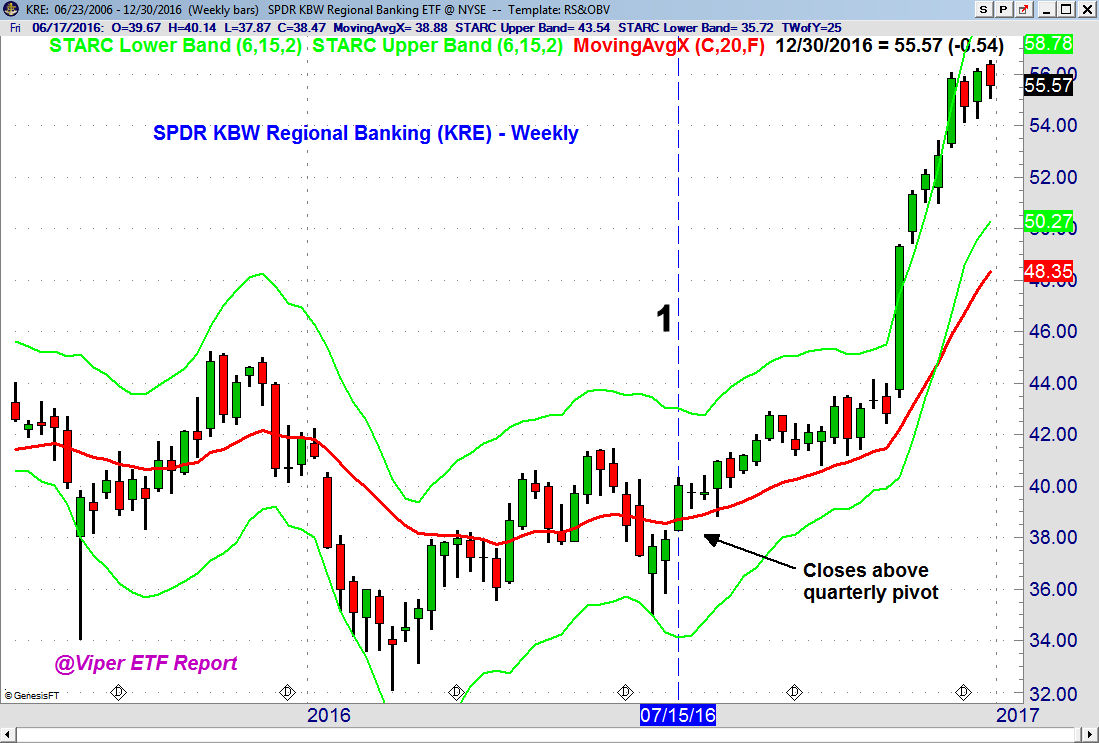
The quarterly pivot analysis is a vital part of the analysis in the Viper ETF Report. One of the 4th quarter best performers was the SPDR KBW Regional Banking ETF (KRE) which was up almost 32% as it has traded above its quarterly pivot since July 2016 (line 1) consistent with its positive trend.
In 2016, like 2015 and 2014 there were many analysts warning of a stock market bubble. Way back in July 2014 an economic reporter even asked President Obama, “Are you concerned there is a bubble out there like we had in ’01 and ’08?”
I concluded in my column on July 25, 2014 "One Bubble Starting to Burst?" that the hedge fund bubble had begun to burst. The decision of Calpers (California Public Employees' Retirement System) to alter their hedge fund strategy in July 2014 was the canary in the coal mine.
As this Fortune article details it has been a rough year for many of the high profile hedge funds as several continued to rack up huge losses from their holdings in Valeant Pharmaceuticals (VRTX) . As Fortune noted " After losing money last year, hedge funds are on track to register their best year since 2013, returning 4.5% as a group in 2016, according to Hedge Fund Research's fund-weighted composite index. That's still not nearly as good as the S&P 500, which has returned 11%."
The downfall of Platinum Partners culminated with arrests in December as it had been liquidating assets since last June. Those who were surprised that it's claimed 17% annual returns since 2003 were part of what "federal prosecutors called a Ponzi-like scheme" need to go back to investment school.
The poor performance over the past few years is another reason informed investors should also be wary of following the advice of the large hedge fund managers who are often featured on financial market TV. Many of the best known hedge fund managers were very negative on stocks last summer and those who followed their advice likely missed out on the 4th quarter rally.
I can't imagine that their clients will be happy when their yearly performance data is released. The high management fees and weak performance is not an appealing combination. Typically the stocks favored by hedge funds often lag the performance of the S&P 500. This is why the relative performance analysis plays such an important role in both my ETF and stock selection process.
The Economy
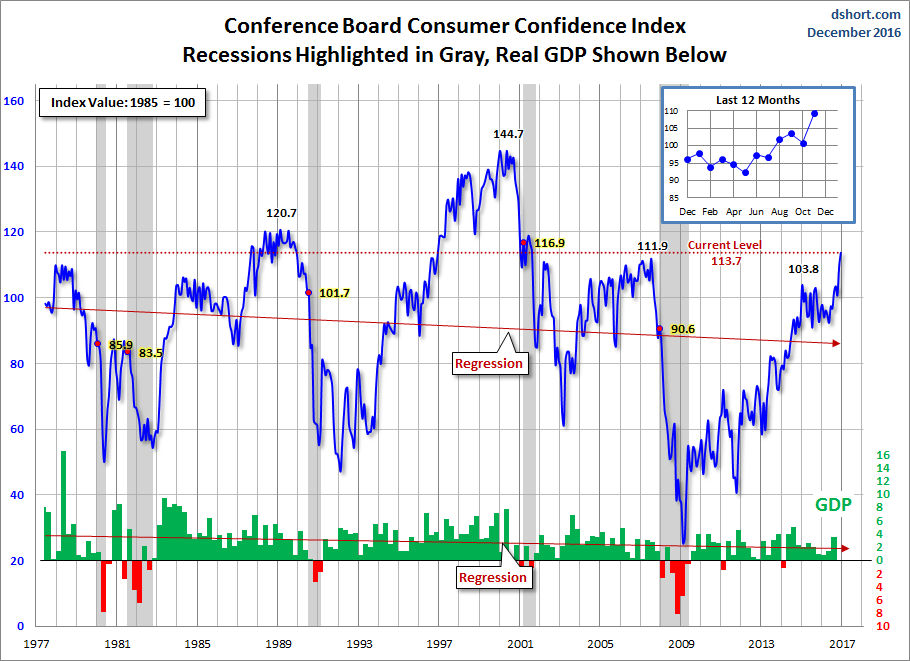
The markets were given a boost when they reopened last Tuesday as the Consumer Confidence soared to 113.7 based on future expectations. This was a thirteen-year high as older consumers are optimistic about jobs, the economy, stock prices and their prospects for income. The long-term chart confirms the strong uptrend of this indicators and the historical analysis bodes well for stock prices and the economy as we enter 2017.
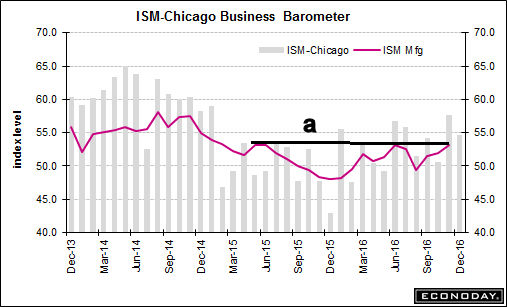
On Friday the Chicago PMI came in a bit lower than expected but the data Tuesday on ISM-Manufacturing and PMI Manufacturing will likely be more important. The chart shows that ISM is close to an upside breakout above the resistance at line a. A breakout will be bullish for manufacturing as we enter 2017.
Construction Spending is also out Tuesday with the ADP Employment Report and FOMC minutes on Wednesday. Both the PMI Services and ISM Non-Manufacturing reports are out on Thursday followed by Factory Orders as well as the monthly jobs report on Friday.
Interest Rates
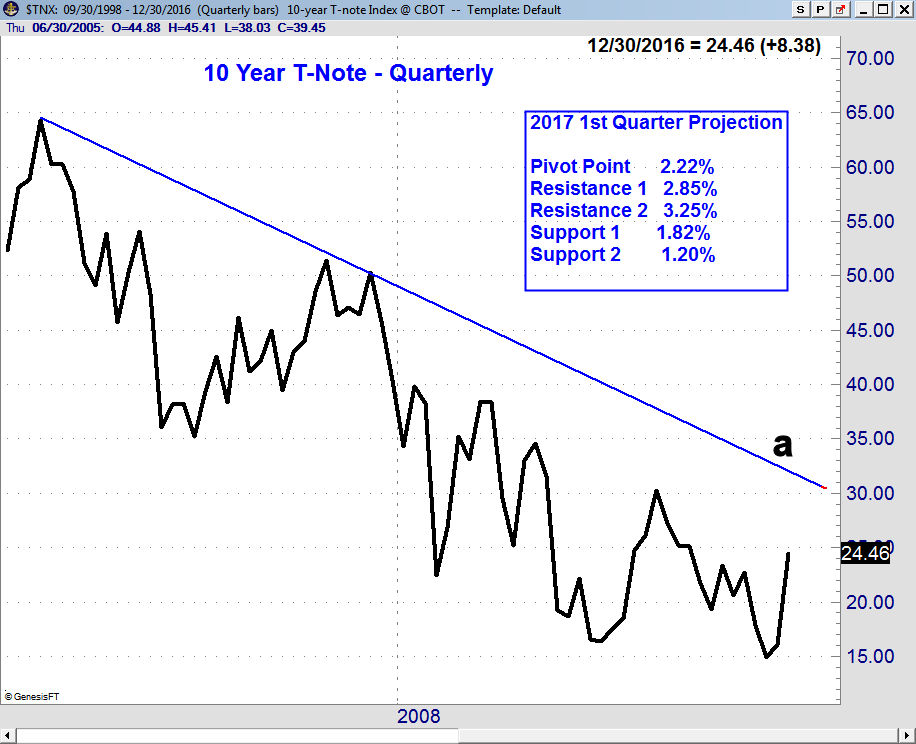
It was a powerful quarter for the bond market as the yield on the 10 Year T-Note rose 0.838% and this is likely to have repercussions as we head into the 1st quarter of 2017 as investors get their year end statements.
As long as the yield does not have a Friday close above the quarterly pivot at 2.22% the trend remains higher. The R1 resistance at 2.85% is a reasonable upside targets as long as the economy continues to improve but many are focused open the long term downtrend, line a, which is in the 3.00% area.
Market Wrap
Both the S&P 500 and Russell 2000 closed the week down over 1% but they did better than the 1.6% drop in the Dow Transports. Still that did not diminish the fine yearly performance as the Dow Industrials were up 13.4% and the S&P 500, with dividends, gained 12%. For the week the declining stocks led the advancing stocks by 1868 to 1223.

The action in the NYSE Composite last week was interesting as it opened Tuesday at 11,601 which was well above the 2015 high of 11,255 (line a) but then closed at 11, 146. The week's high was well above the starc+ band but the lower close is consistent with a reversal.
The close was not far above the good support in the 10,750-11,000 area with the rising 20 week EMA at 10,779. The 1st quarter pivot is at 11,088 so the Friday closes in the first two weeks of 2017 will be important. The NYSE A/D line made a new high a week ago and is still holding well above its WMA. There is major A/D line support at line b.
The Spyder Trust (SPY) dropped below the daily starc- band on Friday and more importantly closed below $224 the prior week's doji low. There is further support at $222 with the 38.2% Fibonacci support from the pre-election lows at $219.28. This corresponds very nicely to the 1st quarter pivot at $219.23. The 50% support stands at $216.96 which could be reached on a sharper correction.
The S&P 500 A/D line made a new high Tuesday before dropping below its WMA and the near term support at line a. As I noted earlier the weekly A/D line is well above its WMA so for Viper ETF clients I will be targeting new buy levels as we enter the New Year.
What to do? The push to the upside last week only lasted one day as stocks spurted to the upside Tuesday but then reversed to the downside. The decline in daily A/D lines below their WMAs is consistent with a further correction and the monthly jobs report is likely to trigger a pickup in volatility.
Any correction is likely to be accompanied by more sector rotation as the market leaders like the transportation and bank stocks are overdue for a deeper correction. We may also see some rotation into the lagging sectors like health care and consumer discretionary stocks.
The converging Fibonacci retracement and quarterly pivot levels indicate that a deeper decline will be a good opportunity for those who are underinvested to start buying. I would use a drop in the SPY below $222 to start a dollar cost averaging that I previously recommended.
For those who would like to learn more about the markets and technical analysis you might consider starting with the trading lessons that are sent out to all Viper ETF and Viper Hot Stocks clients.
My weekly scans of the IBD and Nasdaq 100 stocks are used to find new buy or sell stock candidates. For each stock I then examine the weekly as well as the daily relative performance and on-balance-volume (OBV) data to find the best buy or sell candidates. Specific buy and sell recommendations are then provided to subscribers along with protective stops.
Each service is just $34.99 per month and new subscribers also receive the six most recent trading lessons that are designed to make you a better investor and trader. Subscriptions can be cancelled at any time on line.
Comments
comments