

Stocks opened the New Year on a positive note as the major averages closed with nice gains and the 3-1 positive advance/decline ratios were a good sign. The new high in the Spyder Trust (SPY) last week was confirmed by a new high in the S&P 500 A/D. The daily A/D lines did turn higher Tuesday but to signal a new rally phase we need to see several more days of strong market internals.
For many years I have lamented the financial media's focus on year-end projections for the major averages. The gyrations in 2016 forced many Wall Street strategists to revise their outlooks throughout the year as I reviewed several weeks ago (How High Can The Market Forecasts Go?)
I am lucky that unlike many of these market professionals my job description does not require that I make a year end price forecast. The price targets I provide are based on chart formations and other hard data not on projected earnings or macro views of the economy. The pivot price projections focus on the yearly price ranges but not where stocks will end up at the end of the year.
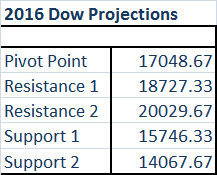
The discussion last weekend on the yearly price projections for the Dow Industrials spurred many email requests for a more in-depth discussion. The chart of the Dow shows that the pivot analysis based on the 2015 price ranges did a good job of identifying the Dow's price highs and lows for 2016.
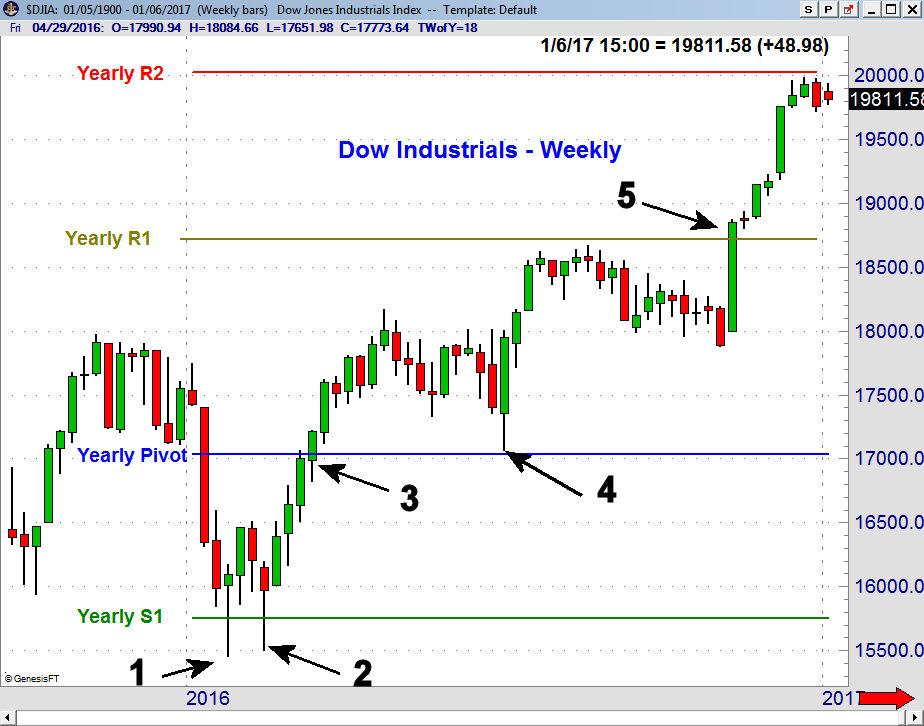
The close on January 6, 2016 at 16, 906 was well below the Yearly Pivot at 17,048 and just nine days later the Yearly S1 support at 15,746 was violated with the Dow trading below it for two days. The actual low for the year at 15,450 (point 1) was 1.3% below the yearly S1 support. At the February 11th low (point 2) the Dow dropped briefly to 15,503 but one week later it closed at 16,413.
By early March, point 3, the Dow closed back above the yearly Pivot as it subsequently rallied 1000 points to reach a high of 18,167 on April 20th. This was just below the Yearly R1 resistance at 18,727. After the Brexit vote the Dow dropped to a low of 17,063 (point 4) but held just above the Yearly Pivot.
The Yearly R1 resistance at 18,727 was surpassed the week of the election (point 5) which made the next upside target at 20,029, the Yearly R2 resistance. The yearly high for the Dow at 19,987 was just 0.2% below the pivot R2 resistance.
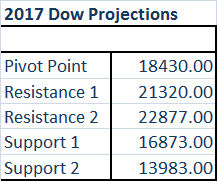
For 2017, the pivot stands at 18,430 with the R1 resistance at 21,320 which is 7.9% higher than the 2016 close. The Yearly S1 Dow support at 16,873 is 24.6% lower.
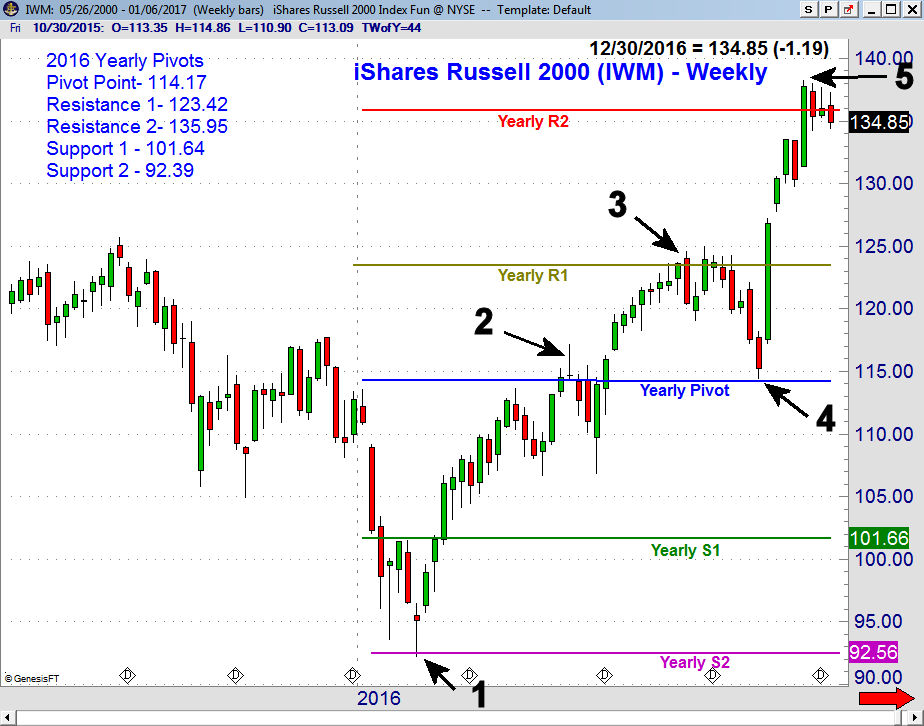
The gains of the small cap iShares Russell 2000 (IWM) in 2016 were impressive. The chart shows that the January plunge took the IWM to $92.21 which was just below the Yearly S2 support at $92.39. It was not until early June, point 2, that the Yearly Pivot at $114.17 was overcome. On the sharp drop in late June IWM held above the May low.
The Yearly R1 resistance at $123.42 was exceeded in September but was not convincingly overcome despite several attempts. The pre-election market correction dropped IWM to $114.41 which was just above the Yearly Pivot at $114.17. The close on December 8th at $137.47 was well above the Yearly R2 resistance at $135.95.
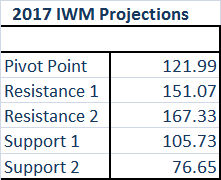
The 2017 Yearly Pivot analysis for IWM is at $121.99 with the R1 resistance at $151.07 is 12% higher than the 2016 close. On the downside the Yearly S1 support at $105.73 is 21.6% lower. The completion of the monthly trading range that I discussed in How High Can The Market Forecasts Go? has long term targets at $159.91 with major support in the $126 area.
The pivot analysis can be done on any time frame but I focus on the monthly, quarterly and yearly analysis. I am currently working on a Trading Lesson that focuses on the yearly pivot analysis for the key market tracking ETFs and the major sector ETFs.
It will be sent out to subscribers of both the Viper ETF Report and the Viper Hot Stocks Report the week of January 9th. It will also be sent out to all new subscribers who will also receive the biweekly reports. Each service is just $34.95 per month and can be cancelled on line at any time.
Comments
comments