

For investors 2016 is likely to be the best Christmas in many years especially in light of how the year started out. The stock market's perception of how stocks will benefit in the new Trump world has clearly caused a stampede into stocks. A several billion-dollar buy program hit the market last Wednesday afternoon which triggered one of strongest daily gains.
The focus has been on the Dow industrials as a number of traders were wearing their Dow 20,000 hats on the NYSE floor last week. Until last week the Dow's rally has been narrowly based as according to Paul Hickey from Bespoke " The top five stocks account for 700 of the just under 1,300 gain" with Goldman Sachs (GS) contributing 400 points or almost 1/3 of the Dow's gain.
With Caterpillar (CAT) the Dows best YTD gainer up over 47%, there are four Dow stocks, Nike (NKE), Cocas-Cola (KO), Pfizer (PFE) and Disney (DIS) are all still down for the year. Disney has regained much of its losses as it is now up over 12% this quarter.
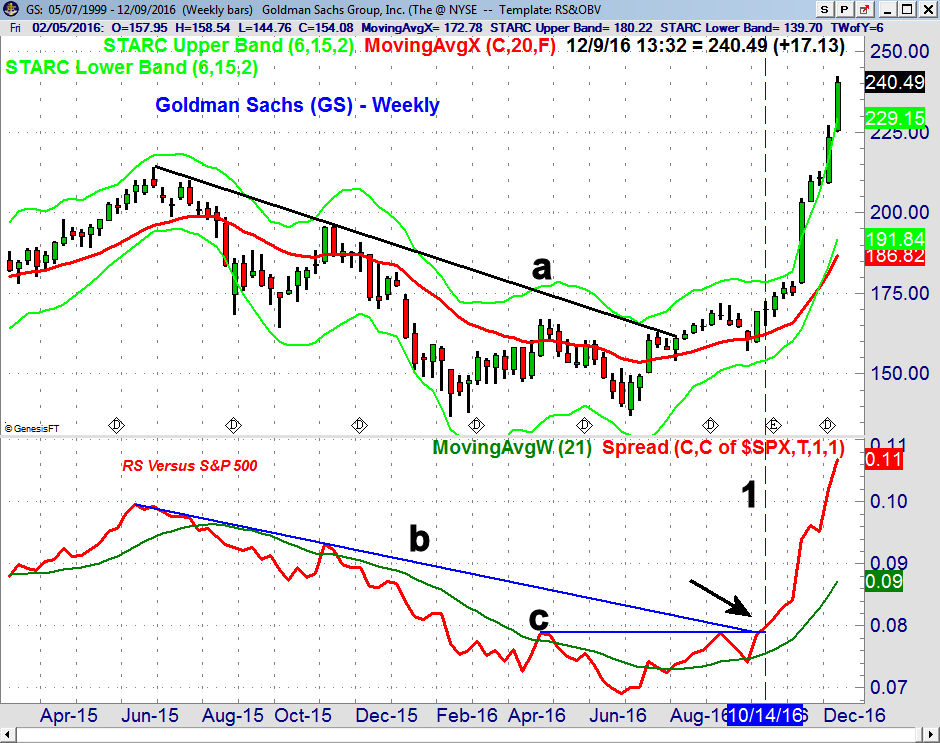
The weekly chart of Goldman Sachs (GS) shows that it broke its weekly downtrend in August, line a, when it closed at $162.11. The weekly relative performance completed its bottom on October 14 (line 1) as the RS broke its downtrend (line a). This was confirmed by the move in the RS above resistance at line c. It is up 33% since the election.
The stock is now very close to its all time high of $247.92 from the end of October 2007. Now maybe the stock 's strength is based on the anticipation that deregulation will make GS even more profitable than it was in 2007. Of course it is also possible that the stock is rising because of the influx of Goldman executives into the new Trump administration. On a personal note I am not in favor turning the Treasury Department over to another Goldman employee as their past performance has been less than impressive.
Now either explanation could be bullish for the stock of Goldman Sachs but does that mean you should now jump into the stocks that have been leading the Trump rally? The powerful action last week (see Market Wrap) does favor even higher prices as we head into the end of the year but things may be different as we move into 2017.
In my many years observing and investing in the stock market I have found that getting into crowded trades has generally turned out badly. Instead those markets that are out of favor generally have a much better risk as well as reward profile.
The dismal performance of hedge funds who often pile into the same trade is an example of how this approach does often not work. Financial stocks make up about 12.8% of the S&P 500 while information technology makes up more that 21%. Health care makes up 14.7% and it could bottom in the coming weeks.
The beaten down consumer staples sector has a weighting of 9.9% but it is only up 4.8% YTD. Both the Technology Sector Select (XLK) and Technology Sector Select (XLK) have been recommended to Viper ETF traders.
Both were recommended with just a 5% initial risk while buying the SPDR S&P Regional Banking ETF (KRE) now would require a stop under the four-week lows and a risk of 11.5%. The Viper position in KRE, as discussed in last week's trading lesson "Developing An Exit Strategy", were sold a few weeks ago but even though I got out early I prefer selling into strength.
For those of you who are dying to jump into this market I would continue to recommend you favor those out of favor stocks or ETFs where the technical studies are turning positive. I would also caution you not to alter your regular risk management approach to investing or trading. When a portfolio takes a big hit after chasing a market it can have a long-term impact on performance. I also know that even the best laid plans of a new president are difficult, if not impossible to implement.
The S&P 500 has already exceeded most targets from Wall Street strategists as their average year-end target was 2146. It has certainly been a choppy year for the stock market despite the positive long-term readings from the advance/decline lines.
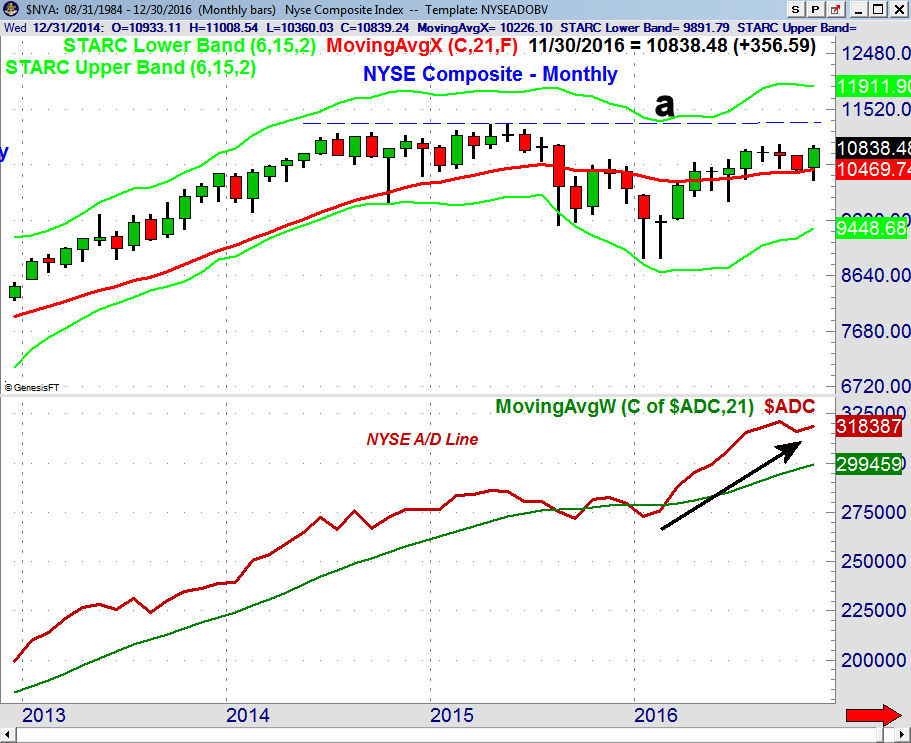
In an early June column I focused on the upside breakout in the monthly A/D line. It turned up in November and is on pace to make another new highs in December. The NYSE Composite is now just below the 2015 high, line a.
I concluded then that the "The technical evidence, despite the concerns over the economy and the weak jobs report, still favors even higher prices. Very few analysts or investors are looking for sharply higher stock prices in the 2nd half of the year but I think it is a real possibility. I would not be surprised to see the S&P 500 reach the 2200 level and 2300 is a real possibility."
Even though a large number of reliable technical measures entered overbought territory a couple of weeks ago that has not stopped the market from moving even higher. A move in the Dow above 20,000 is a real possibility before Christmas but it will be more difficult for the S&P 500 to overcome the 2300 level.
Looking at the Wall Street strategists forecasts for 2017 the average target is at 2345 which is 3.9% above Friday's close. In my view the S&P 500 is likely to trade as high as 2400 and as low as 2120 in 2017 but I have no idea where it will close.
The latest reading from AAII shows that 43.1% are now bullish which is down from 49.9% two weeks ago. It is still below the long-term average at 38.4% but has not yet hit extreme levels above 55%. The bearish % rose to 26.4% as it is up from a recent low of 22.1%.
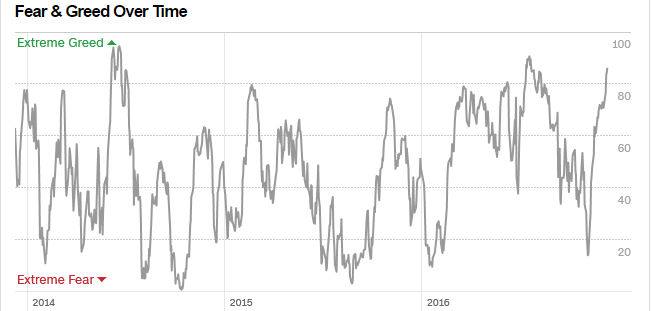
It should not be a surprise that CNN's Fear & Greed Index is at 86 indicating extreme greed which is up from 42 and fear territory just a month ago. The longer term chart shows that is peaked near 90 during the summer and then dropped to 20 just before the election
There were a large number of large hedge fund managers that were bearish at the end of the summer and so far not many have changed their position yet. In September I felt that their high profile negativity was bullish not bearish for stocks.
Many columnists used their negative outlook to support their own bearish forecasts as one commented that all of these big, smart traders couldn't be wrong. I would be a more concerned if the perma bears, like Marc Faber or Peter Schiff, finally turned bullish on stocks.
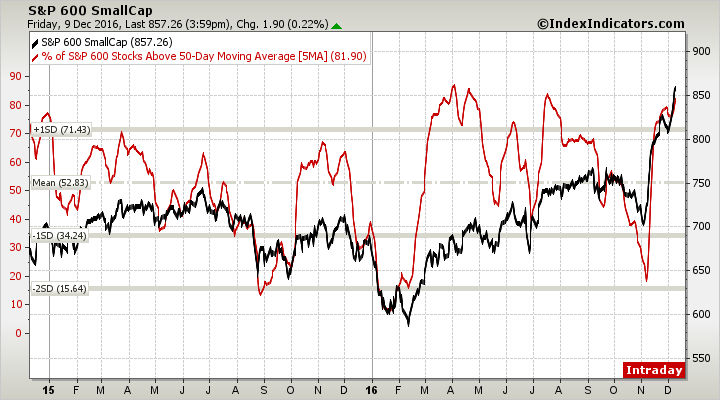
The analysis of the small cap S&P 600 reveals that the 5-day MA of the % of stocks above their 50 day MA has risen to 81.90%. It is now very close to the April and July highs as it is one STD above the mean at 52.83%.
In contrast the same analysis of the Nasdaq 100 shows that only 57.7% are above the 50 day MA which is just above the mean at 53.6%. The 5-day MA peaked well above the 80% level earlier in the year. For stocks pickers and subscribers to the Viper Hot Stocks Report this means that there should be more good stocks to buy.
The Economy
The strong economic data last week helped support the market's bullish tone. Data on the service sector was strong last Monday as both the PMI Services Index and the ISM Non-Manufacturing Index are indicating strong growth.
Factory orders were up 2.7% in a mid week report but Friday's sharp increase in the mid-month reading on Consumer Sentiment to 98 really cheered stock investors as we head into this week's FOMC meeting.
The economic calendar is full this week as in addition to the FOMC announcement Wednesday we have the PPI, Retail Sales , Industrial Production and Business Inventories. They are followed on Thursday by the CPI, Philadelphia Business Survey, Empire State Manufacturing Survey and the Housing Market Index.
On Friday we get the latest data on Housing Starts and quadruple witching which is the expiration date that includes stock index futures, stock index options, stock options and single stock futures.
Interest Rates & Commodities
Both short and long-term yields continued their dramatic rise heading into the FOMC meeting. It is hard to quantify how much of the decline in bond prices has been in reaction to the hiking of rates this week. Certainly the change in rates seems to be pricing in a series of rate hikes in the year ahead. Bond traders may have bought the rumor but will they sell on the news?
The rise in the yield of the 30-Year T-Bond yield has been more relentless than I expected as it has moved well above the 3% level in the past four weeks. The downtrend from the 2011 and 2014 highs, line c, has now been broken. The next major resistance is in the 3.85-4.0% area, line b, with additional chart resistance above 4.5%, line a. Yields are well above the rising 20-week EMA at 2.683%.
The last equally sharp rise in yields occurred in 2012 as yields moved from 2.50% to 3.90%. A similar rise in yields now could take yields to the 3.50% area.
The February crude oil contract has soared from the early November lows and now looks ready to break out of its trading range, lines a and b. This has upside targets in the $60 area. The HPI formed a bullish divergence at the low, line d, that was confirmed by the break through major resistance at line c. It is acting stronger than prices and traders bought the energy ETFs on the November 29th drop.
Market Wrap
For the second week in a row the gains last week were broadly based with 2451 advancing stocks and just 666 declining. Both the Dow and S&P 500 were up just over 3% while the Russell 2000 was up an impressive 5.6%. Even the previously lagging Dow Utilities were up over 2%.
In terms of sectors both the financial and technology stocks were up strong, up 4.6% and 4.3% respectively. Telecommunications, consumer goods, basic materials and consumer services were all up over 3% while health care gained just 0.64%.
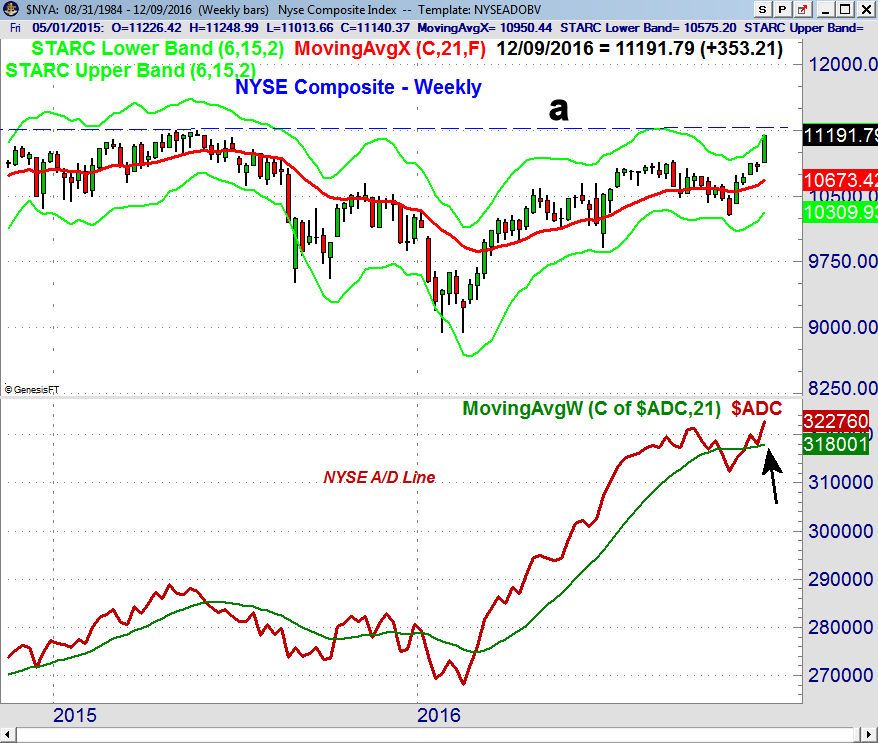
The NYSE Composite finally overcame the resistance at 11,000 and is now just below the 2015 high at 11,254, line a. The NYSE has been lagging the other major averages and is now starting to catch up. The weekly NYSE A/D line shows a bullish zig-zag formation as it has turned up after testing its WMA.
The NYSE has closed above the daily starc+ band for the past three days and the daily A/D line is now well above its rising WMA. The McClellan oscillator turned down on Friday after making a marginal new high last week.
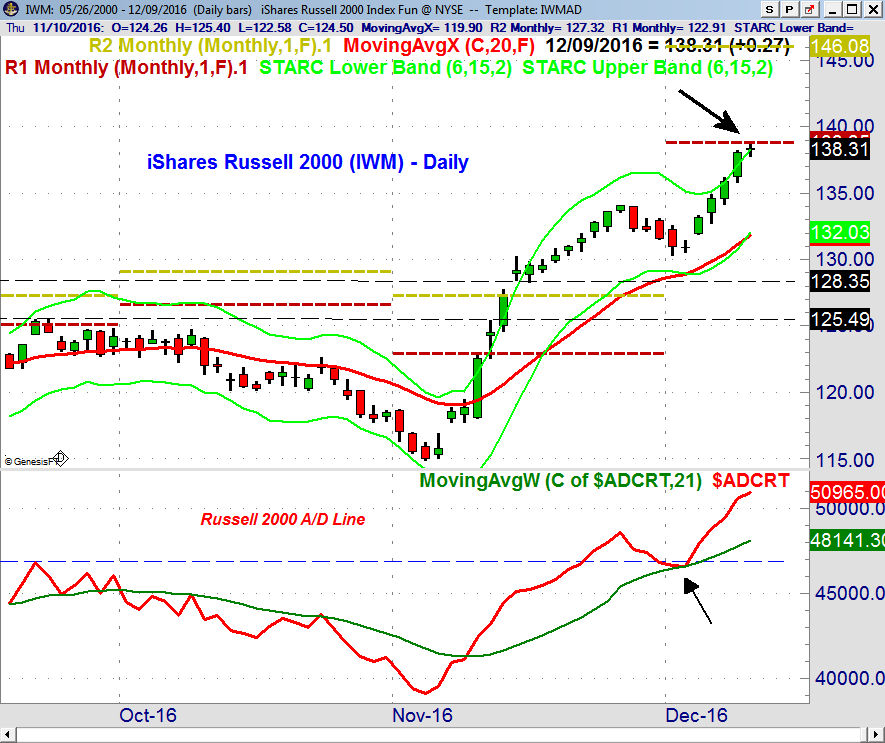
The red hot iShares Russell 2000 (IWM) had another good week though it did form a doji at monthly pivot resistance on Friday. The close was also above the daily starc+ band. The daily doji a week ago set up a good buy on Monday's open for Viper ETF traders. There is extended monthly pivot resistance now at $146.
A daily close below $137.75 will trigger a daily doji sell signal but there is good support now at $134-$135 with the 20 day EMA at $131.81.
The daily and weekly A/D line analysis is positive on the SPY, QQQ and DIA as the Dow Industrials A/D line has finally overcome its major resistance.
What to do? As the major averages continue to power to the upside many who are underinvested in stocks wish they had more. I think the main danger now is that investors may jump into stocks once they see how poorly their bond funds have done this year. Even though it is not easy I think a patient approach will be rewarded as yields are likely to turn lower in the next month.
In April I suggested that "those who were not invested should consider a dollar cost averaging program where six equal investments were made over a period of time. Those non-active investors should consider a broadly diversified ETF like the Vanguard Total Stock Market ETF (VIT) or the Vanguard MSCI Europe (VGK).'
Though these ETFS are much higher now this I think is still the best approach for those not in the market. As I mentioned earlier there are still some ETFs that are still declining or have just bottomed and the risk on these ETFs is more reasonable.
Though it may be surprising there are a number of stocks that are trading near their yearly lows and just need a strong close on good volume to complete their weekly bottom formations. I am looking for stocks like this to recommend to the Viper Hot Stock clients.
Comments
comments