The stocks market's sharp drop last Tuesday was consistent with the deterioration in the market internals but was contrary to the trader bullishness on Monday (Stocks Melt Up? Not So Fast). The lower weekly close has already cast its shadow on the first full week of the earning's season.
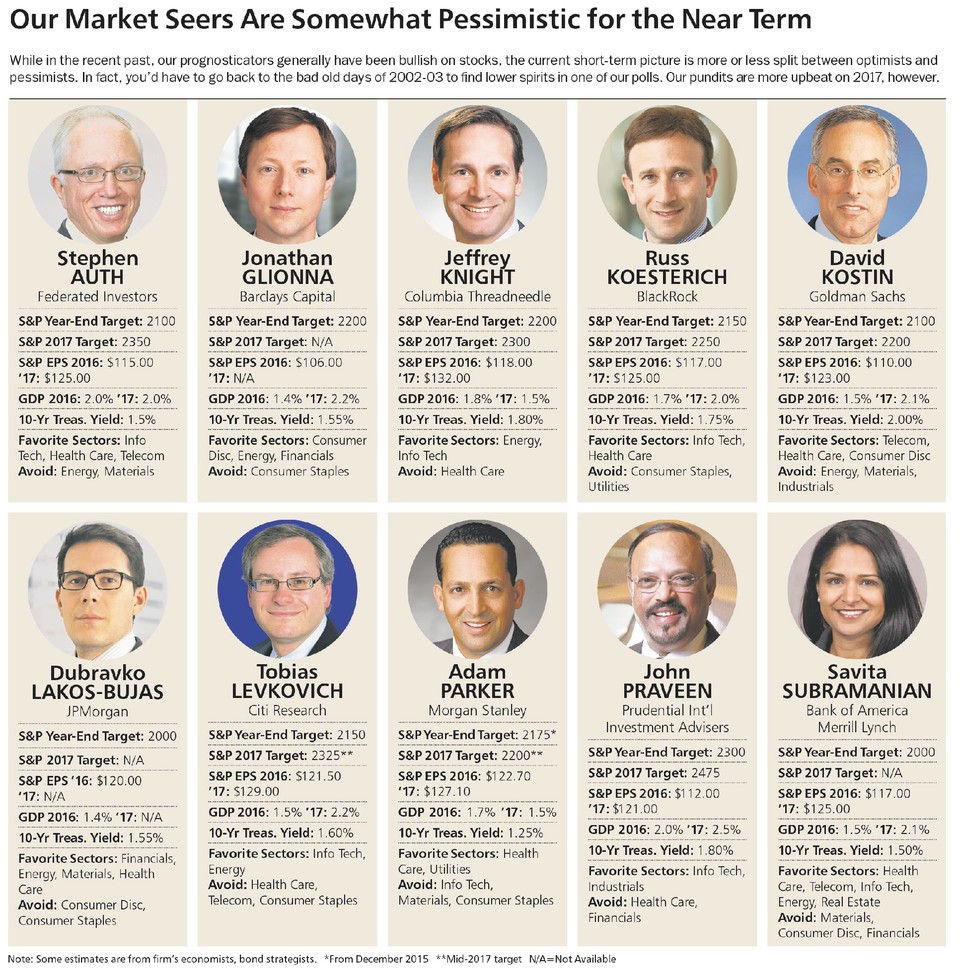
In a Barron's column from early September, Strategists Say Beware the Bear, they surveyed 10 Wall Street Strategists for their current market outlook and found that "Four strategists call themselves bullish, three are in the bear camp, and three are neutral." Their surveys are conducted twice a year and those interviewed were more bearish than in past years.
In late 2015 they were looking for a 10% gain in 2016 with an S&P 500 mean expected target of 2220. By September "Their mean expectation for the Standard & Poor’s 500 index is 2138 at year end" which is just below Friday's close.
Before looking at the range of the strategist's forecast it is important to note that I have frequently commented that making yearly forecasts is a losing proposition. Many of the experts might agree but because of their position and the long tradition they likely have little choice. I do pay attention to the range of their forecasts as their market views are provided to a large number of clients.
My view of the markets is determined in a large part by the monthly, weekly and daily analysis of the advance/decline lines or the market internals. In 2016 both the weekly and daily A/D lines did not turn positive until late February. It was the subsequent new monthly high in the A/D lines that turned my outlook bullish for the rest of the year.
Two of the experts are looking for 2000 at year-end which would be a drop of about 6.6% from current levels. On the high end is Prudential International Investment Advisor's John Praveen who is looking for 2300. Their reasons vary and I would encourage you to read the entire article.
In early June I commented that "The width of the recent trading range has upside targets in the $218-$220 area. The multi-year trading range has major upside targets as high as $240." The 2016 high so far in the Spyder Trust (SPY) is $219.60. The major upside targets are still valid for 2017.
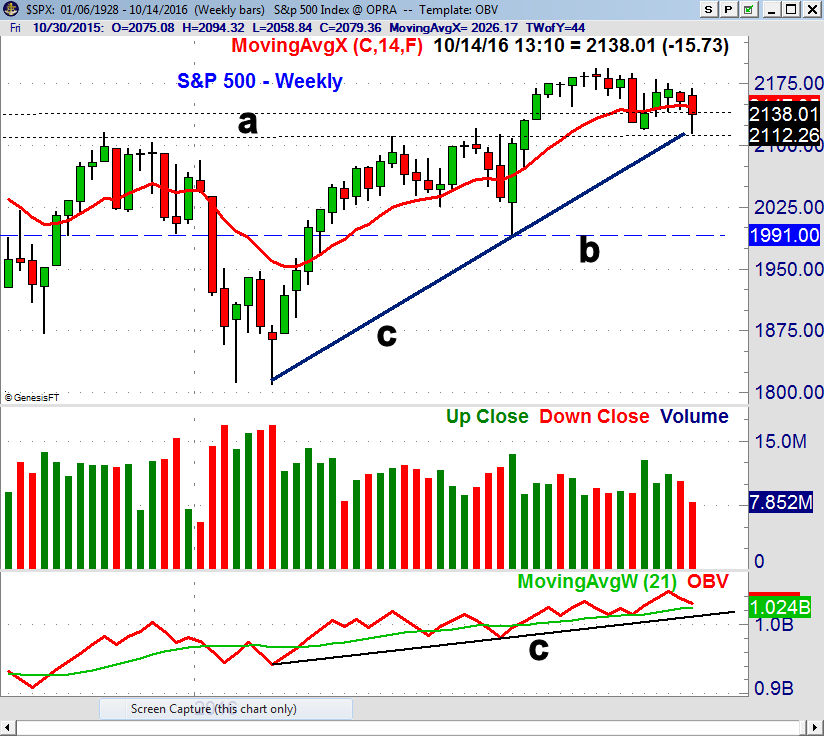
The S&P 500 dropped last week into the initial support zone (line a) but closed the week well above the low of 2114. The chart shows that the support from the year's lows, line c, was tested. There is a band of even stronger support now in the 2050-2080 area.
A weekly close well above 2200 would complete the fourteen-week trading range with upside targets in the 2280-2300 area. It would take a weekly close below 1991, line b, in order to invalidate the prior upside breakout. The weekly OBV has turned down but is still above its WMA and support at line b.
Several of the experts do favor some of the emerging markets and while the country ETFs do have a higher risk they also have a higher potential reward. This is one of the reasons I have added a weekly review of country and international ETFs to the Viper ETF Report.
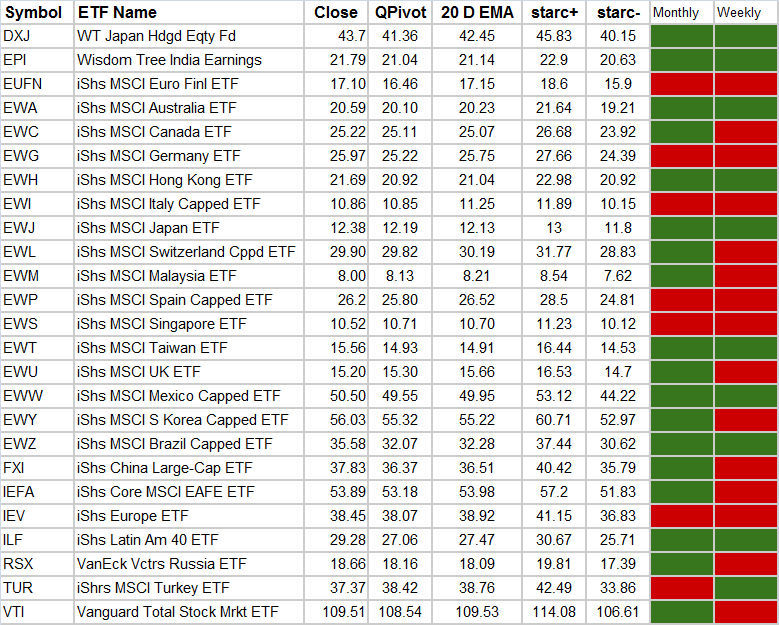
This table is published each week and new recommendations are made in either the Monday or the Thursday report. For each ETF I provide the quarterly pivot , starc bands and color coded analysis of whether the monthly or weekly technical studies are positive or negative. Currently our only long positions from mid-September is in the iShares S&P Latin America ETF (ILF) which just broke out of its weekly triangle formation.
In Thursday's data the AAII bearish % jumped 5.8% to 33.7% while the bullish % fell 3.3% to 28.8%. A further decline in the S&P 500 could cause the bullish % to drop to oversold levels in the next few weeks. The recent data from Investors Intelligence shows a fairly high level of bullishness but I do not think this by itself is conclusive.
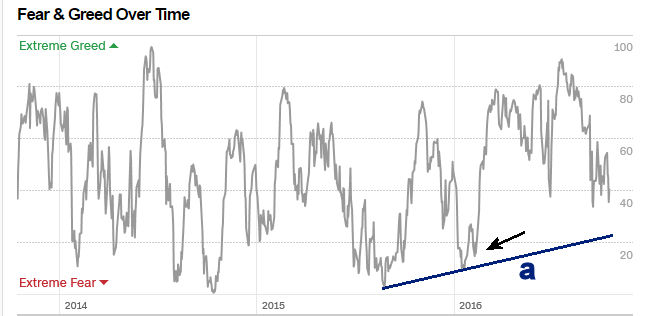
The long-term chart of CNN's Fear & Greed Index shows that it is at 41 and has long-term support below 30. It was well in greed territory early in the year as it formed a bullish divergence at the February lows (see arrow). This coincided with similar divergences in my other technical indicators.
As I have commented previously I do not see this as a pure sentiment indicator but feel it is a mixture of both sentiment and technical indicators. At the August 2015 lows it was under 10 which did coincide with an extreme in bearish sentiment
The Economy
It was a mixed week for economic data as the sharp rise in yields on the 10-Year Note got most of the economist's attention. For a good part of the year the financial press has been inundated by articles stating that we are already in a recession or that one is unavoidable.
A recent survey of 59 business, financial and academic economists by the Wall Street Journal in early October revealed that the "odds of the next downturn happening within the next four years at nearly 60%. Overall they are looking for a continued slow growing economy with a 20% chance of a recession next year. The new president is the main wild card.
The latest FOMC minutes further supported the consensus view that the Fed will raise rates at the end of the year. Friday's sharper than expected 0.3% rise in Producer Prices will have more looking to the CPI report out this Tuesday.
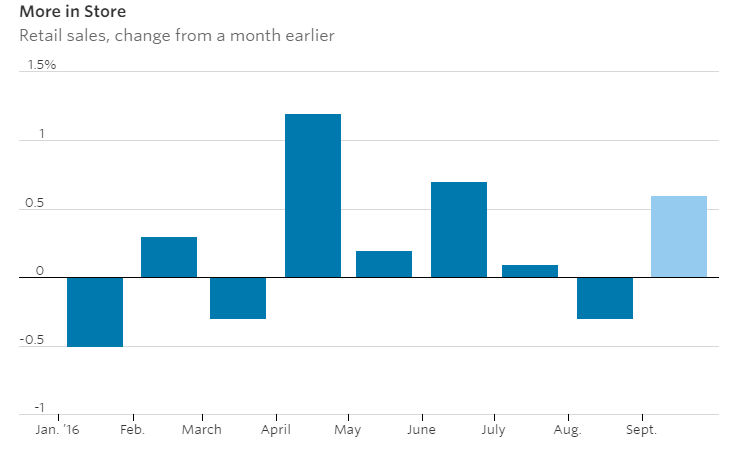
The 0.6% rebound in Retail Sales was expected but still the data was encouraging. Further improvement is needed in the months ahead to provide convincing evidence that the consumer is confident. That confidence wasn't evident in the mid-month reading of 87.9 in Consumer Sentiment which was the lowest reading of the past year.
On Monday we get the Empire State Manufacturing Survey and Industrial Production followed on Tuesday by the CPI and the Housing Market Index. There is more data on homebuilding Wednesday with the Housing Starts and then Existing Home Sales on Thursday.
The ECB is meeting also on Thursday and we also get the jobless claims, the Philadelphia Fed Business Outlook Survey and the Leading Indicators that were down slightly last month.
Interest Rates & Commodities
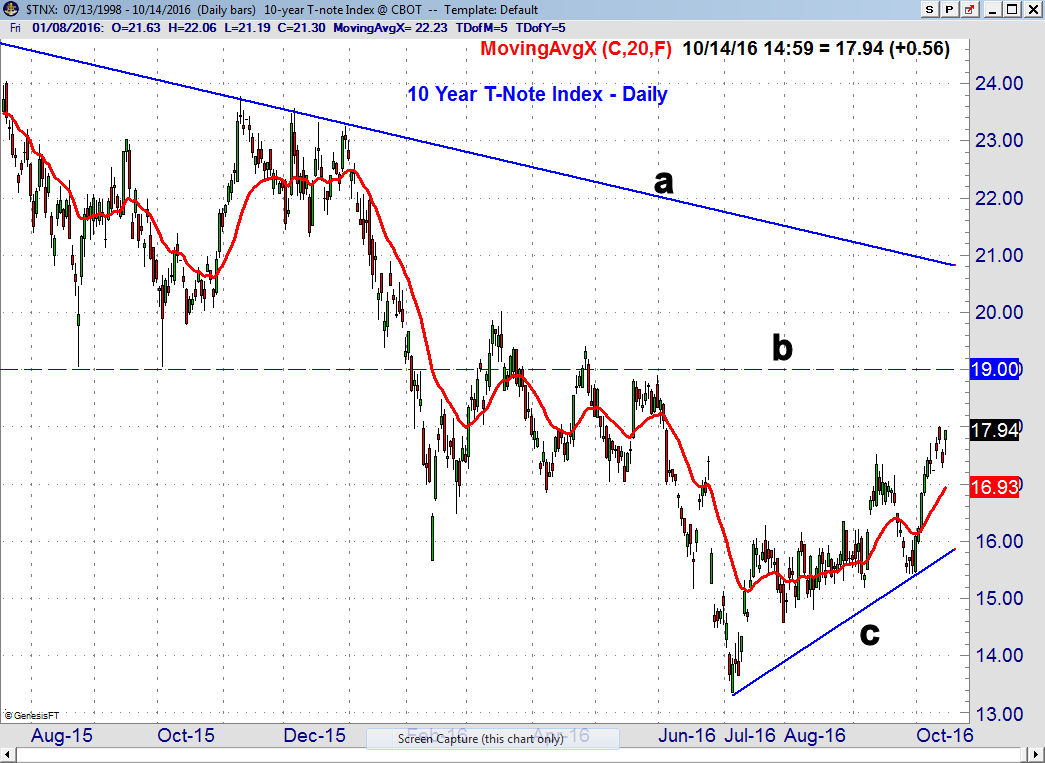
The yield on the 10 - Year T-Note continued to rise sharply last week closing Friday at 1.794%. The daily chart shows that from earlier in the year there is a band of resistance from 1.80-1.90%, line b. The 50% retracement resistance from the June 2015 high at 2.40% is in the 1.90% area.
The longer term downtrend, line a, is just below 2.10%, The rising 20 day EMA is at 1.693% so a pullback to its EMA would not alter the current upward trend but would definitely get the market's attention.
The dollar index was very strong again last week as it closed above the July highs. The sharply lower British Pound is playing a large role in the dollar index's strength as it makes up 11% of the index. As noted a few weeks ago the Herrick Payoff Index (HPI) and volume are both positive.
The gold futures have dropped down to the 38.2% retracement support from the late 2015 low. The 50% support stands at $1210 and there are no signs from the daily or weekly studies that gold has bottomed.
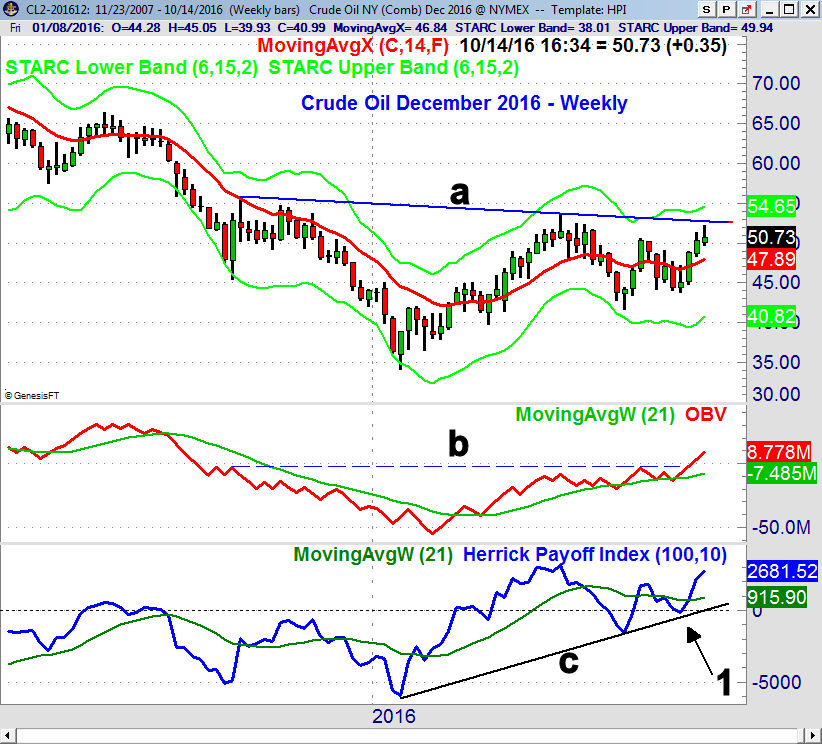
Crude oil has continued to be very strong after the daily buy signals on September 29th as December crude has surged from under $46 to over $52 barrel. A move above the major resistance in the $53 area (line a) will complete what appears to be a reverse head and shoulders bottom formation. The long-term targets from this formation are in the $68-$70 area.
The weekly OBV has already completed its bottom as it has moved above the resistance from 2015, line b. The weekly HPI dropped below the zero line for one week during the correction and tested its uptrend, line c. It has since accelerated to the upside as it has moved above the previous peak. The positive daily analysis does allow for a pullback over the near term.
Market Wrap
The losses last week were broadly based as only the Dow Utilities managed to close higher. The S&P 500 and NYSE Composite both lost near 1% while the small cap Russell 2000 was down 1.95%. For the second week in a row the declining stocks led the advancing ones by a 2-1 margin.
The health care sector was the big loser down 3.4% while the basic materials lost 1.9%. Both the oil & gas and industrial sectors were down close to 1%. The analysis of the Nasdaq 100 and S&P 500 stocks above their 50 day WMAs have resumed their downtrends. They could reach oversold extremes in the next few weeks. The market is now focused on earnings and the big banks last week did better than most expected.
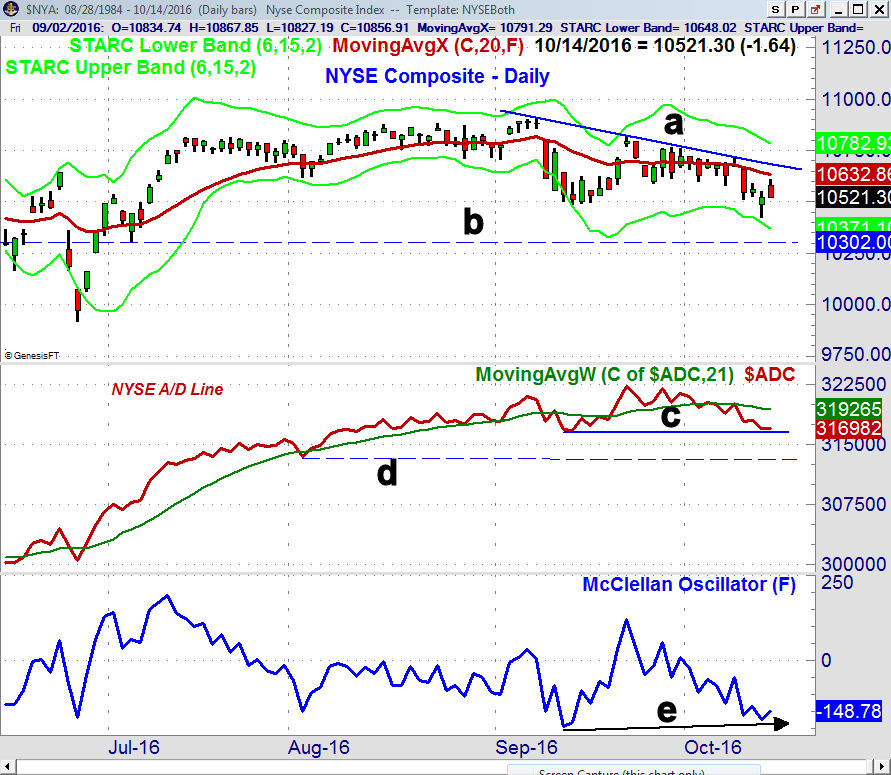
The NYSE Composite became very oversold after Tuesday's decline which favored a sharp rebound in the next few days as I noted in an interim email update to Viper Hot stock clients. The bounce Friday was disappointing as the averages closed well below the day's highs and the NYSE failed to reach its 20-day EMA. It closed the previous week below the quarterly pivot at 10,644. A move above 10,720 is needed to break the downtrend, line a.
The NYSE A/D line has dropped back to the September lows which is holding. The S&P 500, Nasdaq 100 and Russell 2000 A/D lines have violated their September lows but not the more important support from August. This is consistent with the technical deterioration I noted last week.
The McClellan oscillator is trying to turn up from moderately oversold levels, line e, but shows no signs yet of a bottom. The number of stocks making new highs has weakened in the past two weeks but there has been no strong increase in the number of new lows yet.
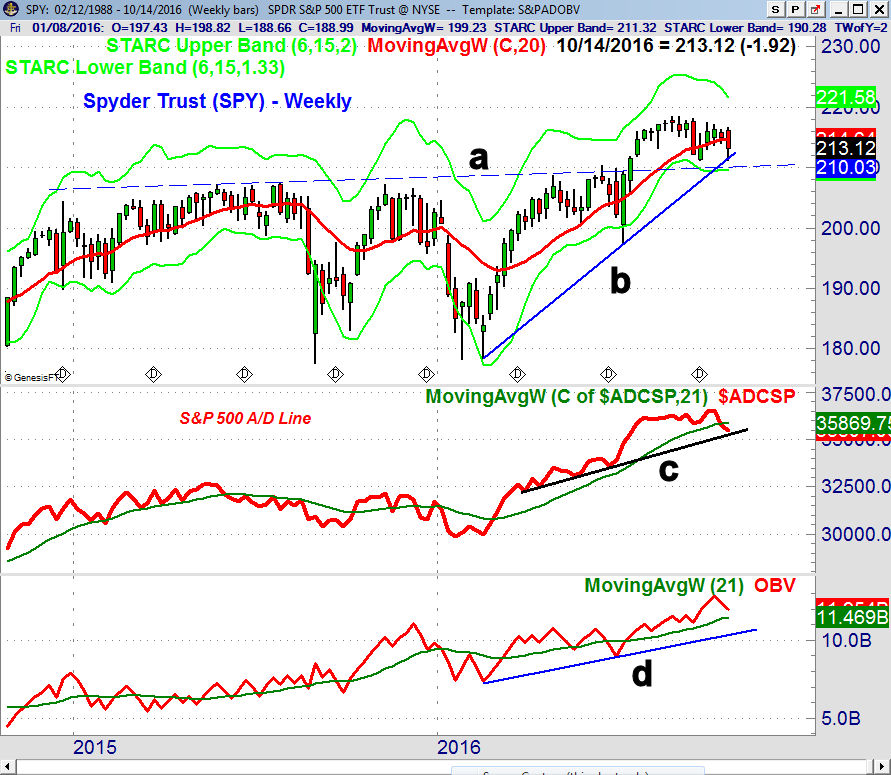
The weekly chart of the Spyder Trust (SPY) is now testing its weekly support at line b. There is additional long-term support in the $210 area, line a, with the weekly starc- band at $209.52. The Friday close was below the quarterly pivot at $214.32 and the declining 20 day EMA at $214.77 is first resistance. The IWM also closed below its quarterly pivot at $120.80 but the QQQ is well above its pivot.
The S&P 500 A/D line closed below its WMA for the first time since late February. The WMA is flattening out and it will take several weeks before it turns lower. It is still above the support at line c. If the A/D line fails to rebound sharply in the next few weeks we could see a correction that lasts until the election. The weekly OBV is still clearly positive as it is well above its WMA and support at line d.
The Put/Call ratios and sentiment are currently not at levels consistent with the start of a major decline as the bullish sentiment in particular is not that far from bearish extremes . Viper ETF traders raised stops last week on the market tracking ETF positions and went long a triple inverse ETF.
What to do? Since the A/D lines are in the corrective mode the path of least resistance is on the downside for at least the short term. Though the evidence does not yet suggest a major decline a day or two of panic selling is possible before the correction is over.
It would take some time and a possible test of the recent highs before intermediate top is completed. A drop in the SPY to the support zone at $208-$210 would not change the intermediate term trend. The market leading PowerShares QQQ Trust (QQQ) could hold above its quarterly pivot at $114.82 on a weekly closing basis.
There are no signs yet of a recession on the horizon as one of my favorite economic measures, the Leading Economic Index is positive and has a good record of topping out well before a recession. This means that a bear market is also not imminent.
Therefore I continue to favor stocks and think the S&P 500 could end the year close at 2200 or higher. For investors I will be looking to add to positions in technology, regional banks and the transportation stocks at stronger support.
My weekly scan of the Nasdaq 100 and IBD Top 50 stocks after Friday's close revealed 43 stocks with new weekly sell signals. For each of these stocks I look at the monthly, weekly and daily charts to find new recommendations for Viper Hot Stocks traders on Monday.
Comments
comments