

Forbes.com: January 10, 2024:
As pointed out by Bloomberg at the end of 2023 “Everyone Got Burned..” a majority of Wall Street strategists not only missed the 2023 stock market rally but the bond experts did not do much better.
Having studied the stock and bond markets for forty years a consensus opinion is unusual and rarely right. In early 2023, the prevailing opinion was that a recession was inevitable as the early debate focused on whether it would start during the 2nd quarter or later in the year. Many based their opinion on their fundamental view that the inversion of the yield curve guaranteed a recession.
My outlook for the bond market has always been based on technical analysis whether I am looking at the treasury futures, cash markets, or yield data. There was nothing that I saw at the start of 2023 that supported “the year of the bond “ which suggested bond yields would go much lower.
Bob Michele, chief investment officer for fixed income at J.P. Morgan Asset Management, thought the 10-year yield could come down as low as 3% by August. He concluded in October that “we have to respect the market technicals“ as the yield was approaching 5%.

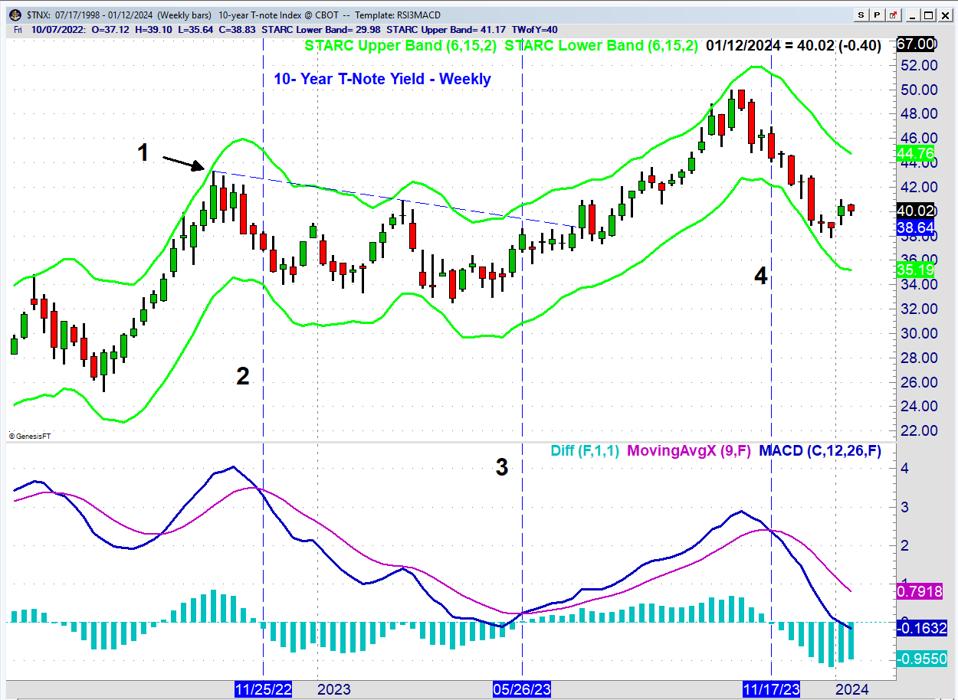
The 10-year T-Note yield rallied to the weekly starc+ band in October, point 1, which was a sign that yields were stretched on the upside. On November 25th (line b) the MACD and MACD-His both turned negative which favored lower yields. They drifted lower until May 26th when the MACDs turned positive. Six weeks later the downtrend in yields at 3.841% was broken and eventually, yields reached 5% in October 2023 as many of the bond bulls changed their opinion.
My daily analysis of the 10-year yield turned negative on October 13th 2023 (see chart). The key upside reversal in the stock market a week before in reaction to the September 2023 jobs report caught most economists by surprise. The current analysis does allow for a rebound but no signs yet of a weekly trend change.

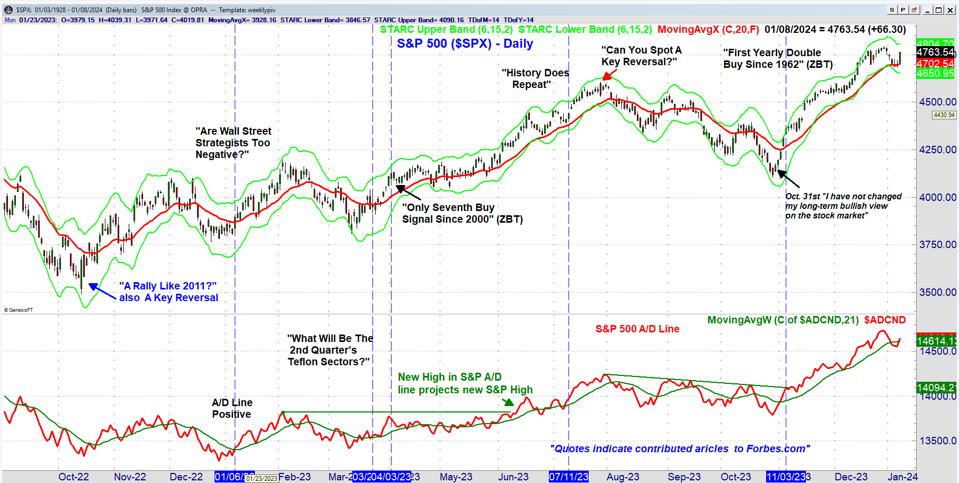
Reviewing my writings for 2023 reinforces the view that it was not an easy year to analyze the stock market. The key reversal on October 13th reminded me of a similar bottom on October 4th 2011 as the stock market finally got over the debt downgrade. The S&P 500 Advance/Decline line stayed positive until December 2022 but finished the year negative.
That quickly changed on January 6th when the A/D line turned positive again. That was accompanied by the news that the mean year-end S&P 500 price target of the 22 Wall Street strategists surveyed by Bloomberg was 4078. This indicated little change from the current level. In my Forbes.com article, I thought they were too bearish on the stock market.
The orderly correction into the March lows was followed by only the seventh Zweig Breadth Thrust buy signal since 2000. That helped kick off a 12.3 % rally into the July highs that ended with a key reversal on July 27th. At the time, the correction was expected as the S&P 500 A/D line had turned negative.
The stair-step decline lasted longer than I expected but the daily resistance in the S&P 500 A/D did not turn positive until November 3rd. The very sharp drop at the end of October was a surprise to me as well as other bullish analysts. After a weekend of reviewing the data, I determined that the action had not changed my year-long bullish view of the stock market.
The further sharp gains and the 2nd ZBT buy signal on November 3rd, 2023 further supported the bullish case. The S&P 500 dropped the first week of the New Year as the 20-day EMA and the monthly pivot at 4703 were briefly violated last Friday. The strong close on Monday was enough to move the S&P 500 A/D line back above its WMA.
The decline last week was concentrated in the growth stocks as the iShares Russell 2000 (IWFIWF) was down 2.8% but the iShares Russell 2000 ( IWDIWD) was down just 0.41%. The weekly chart of the IWF/IWD ratio shows that it has closed below the 20-week EMA which could mean a top is forming as the MACD analysis is negative. A weak rebound in the next month will support the formation of a top while a strong rally could keep the ratio favoring growth as does the RS analysis.
With the CPI report on Thursday, PPI on Friday, and the start of earnings it makes the weekly close even more important. A decline below last week’s lows will mean that the correction from the late December highs is not over yet.
A further decline at the start of February will help lower the high bullish sentiment from the end of the year. The strong market performance last quarter creates a bullish outlook for 2024 so a further correction in early 2024 should be a buying opportunity.
Fundamental analysis still dominates the financial markets and media. One of my primary problems with fundamental analysis is that its followers do not always use stops to limit the risk or loss. In my view, this made the losses worse after the value-led bull market that ended in October 2007. Therefore always use protective stops and try to limit the loss on any position to 5%.
I appreciate those who have missed my commentary over the past month but I am now back on my regular schedule.
Comments
comments