

The market behavior in 2021 and early 2022 reinforced the importance of monitoring the New High and New Low data on both the NYSE and Nasdaq Composite. This analysis is part of my daily routine even though warnings from this analysis can persist for some time before there are clear signals of a market decline.
In a strongly up-trending market, the number of New Highs is expected to expand as prices move higher. This is especially true just after a market correction. However, as the rally continues the number of stocks making New Highs will often peak out and decline even though the market averages are still moving higher. This divergence can last for several weeks or even months before the stock market turns down.

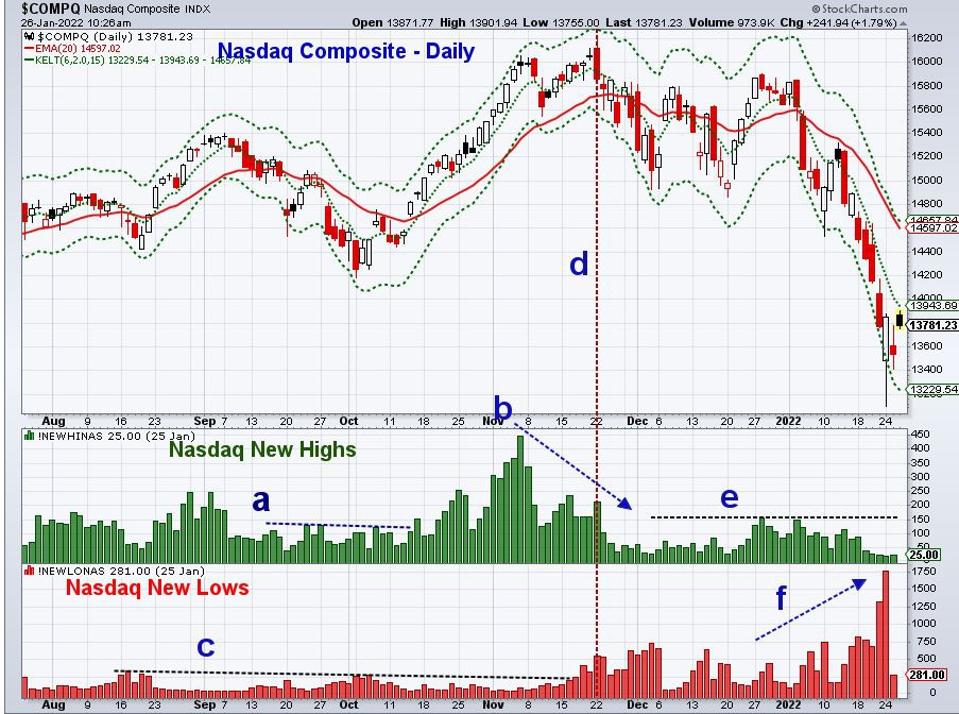
Sometimes the signals are more pronounced in the more volatile markets like the the Nasdaq Composite. The New Highs peaked at 250 on September 2nd 2021 and started to decline with the market. Midway through the correction, which ended in early October, the new Highs dropped to 22. The number of New Lows stayed low during the decline and below 200, line c.
On October 15th the new Highs rose to 138 and above the resistance at line a. This was a positive signal and the New Highs expanded to 445 on November 5th. After a two-day pullback, the Nasdaq turned higher and peaked on November 22nd. Only 214 stocks made New Highs, which was well below the early November peak, and formed a negative divergence, line b. The fact that fewer stocks made New Highs was a sign that the Nasdaq Composite was less strong than it was on November 5th.
This sign of weakness was confirmed when the New Lows surged to 409 on November 18th which was above the resistance at line c. As the Nasdaq Composite corrected the New Lows surged to 732 on December 3rd. When the Nasdaq started to decline at the start of 2022 the New Lows rose to 740 on January 10th while only 87 stocks made New Highs.
On Monday, January 24th there were 1755 New Lows with just 18 New Highs. I am watching for the New Highs to exceed 157 to indicate that the selling pressure has subsided.

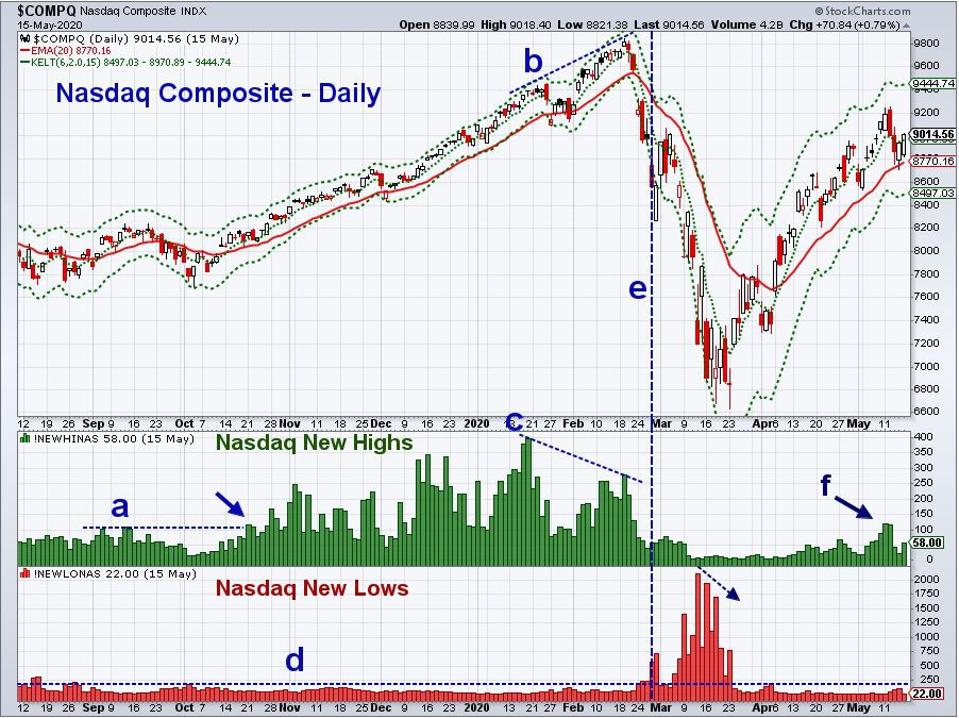
There were also similar signs in the Nasdaq Composite before the March 2020 market decline. In October 2019 the Nasdaq Composite began to rally as the New Highs rose to 116 as the September high, line a, was overcome supporting the rising market.
The New Highs expanded in November through January peaking at 394 on January 17th, 2020. Four days later the Nasdaq peaked at 9451 before correcting for a few days. The rally soon resumed as the Nasdaq made a significant new high at 9838 on February 19th but only 279 stocks made New Highs. The negative divergence, line c, is quite significant when compared to the higher highs in price, line b. On February 24th the New Lows surged to 186 which was well above the highs for the prior six months, line d, and was a very negative sign.
The number of New Lows expanded sharply peaking at 2097 on March 12th which was seven days before the price low on March 23rd when there were just 781 New Lows (see arrow). The New Highs expanded gradually in April and did not move above 100 until May 12th (point f) which was a positive sign even though the Nasdaq had already rallied sharply. In my opinion, the New High/New Low analysis is more helpful in alerting one to a market top than a market bottom.

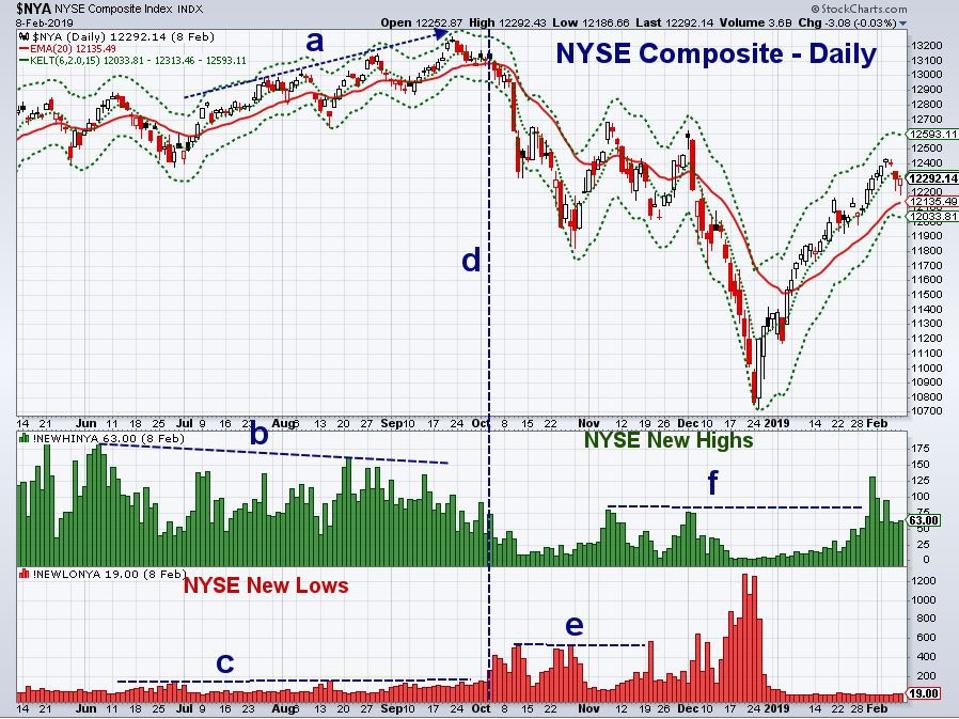
In most cases, similar signals are observed when you look at the data on the NYSE Composite. After the NYSE had corrected in June 2018, it turned higher in July and made a series of new highs in July, August, and September as indicated by line a. The NYSE New Highs peaked on June 6th at 190 but there were only 162 on August 21st, line b. When the NYSE Composite made a new price high on September 21st only 103 NYSE stocks made New Highs.
On October 3rd the New Lows rose to 262 which was well above the August high of 153, line c. The next day there were 426 New Lows and when the NYSE dropped sharply on October 10th there were 502 New Lows. The October peak in the number of New Lows, line e, was not exceeded until November 20th until they rose to 572. This suggested that the sideways price pattern might be resolved by a further market decline.
As the NYSE Composite dropped sharply on December 6th the New Lows rose to 648 and eventually peaked on December 20th at 1270. The NYSE was making a panic low on December 24th along with the other market averages and there were 1256 New Lows.
The NYSE started to rally on December 26th but the number of New Highs did not exceed the November highs, line f, until January 31st when 132 NYSE stocks made new highs.
This New High/New Low data supports the more precise warnings of a market decline from advance/decline analysis as it is very helpful in confirming your market view. A review of January’s market action and the technical outlook will be released after the end of the month.
Comments
comments