

As the S&P 500 made another new closing high on Tuesday the bond and gold market have started to move in the opposite direction. It is too early to be confident that bond yields have really bottomed but the technical divergences in gold, when combined with extremely high level of bullishness in the futures market, has been warning of a top for several weeks. The 22% increase in gold margin rates on June 24th sent another warning signal. Some recently have been concerned that stocks, bonds and gold have all moved higher.
The concern over the health of the stock market only intensified with the Brexit vote as there was a new flood of financial posts as to why stocks had to move lower. Postings have not abated over the past few weeks as I have been receiving 6-8 new bearish articles daily from SeekingAlpha.com where my articles are also often featured. As I pointed out last weekend " What Are Those Bear Market Forecaster's Missing?" many who are negative do not provide any criteria that would change their outlook.
Of course many of these bearish arguments have been popular for many years but this year the bearish bandwagon has swelled significantly. Even some technical analysts have joined the bear camp but often they focus only on momentum indicators that are derived from the same price data. Most do not look at the NYSE advance/decline line or the market internals that I have favored for over thirty years as they can provide a much different picture of the market's overall health.
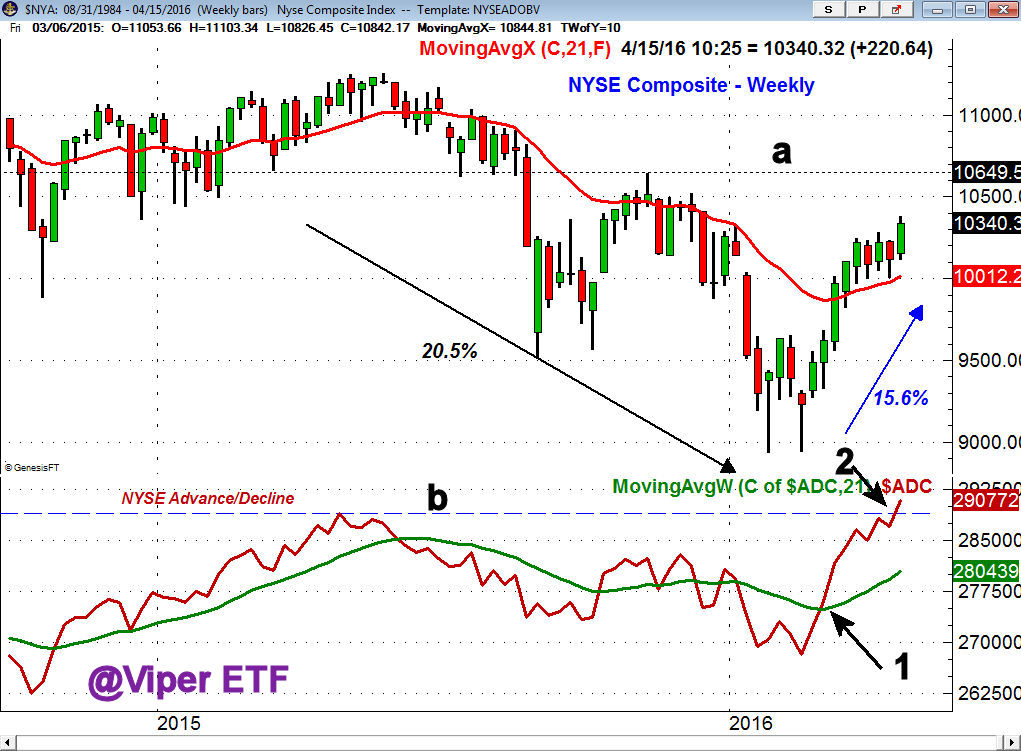
In my late February column "Should Investors Ignore "The Wall of Worry"? I pointed out that "the weekly NYSE A/D line has moved back above its WMA for the first time since the start of the year." By April 15th it was clear from the chart that the weekly NYSE A/D line had overcome the May 2015 high (line b). This was bullish for the intermediate term trend and by early June the A/D lines for all time frames had made new highs.
The market is currently overextended and is likely to see some profit taking. As I am always on the hunt for stocks to buy. Therefore I found the list of sixteen stocks on Goldman Sachs sell list recently published by The Street.com quite interesting.
I ran this list through the scanning process that I run each week for my Viper Hot Stocks clients and found two stocks on the list that look ready to move higher not lower based on my analysis.
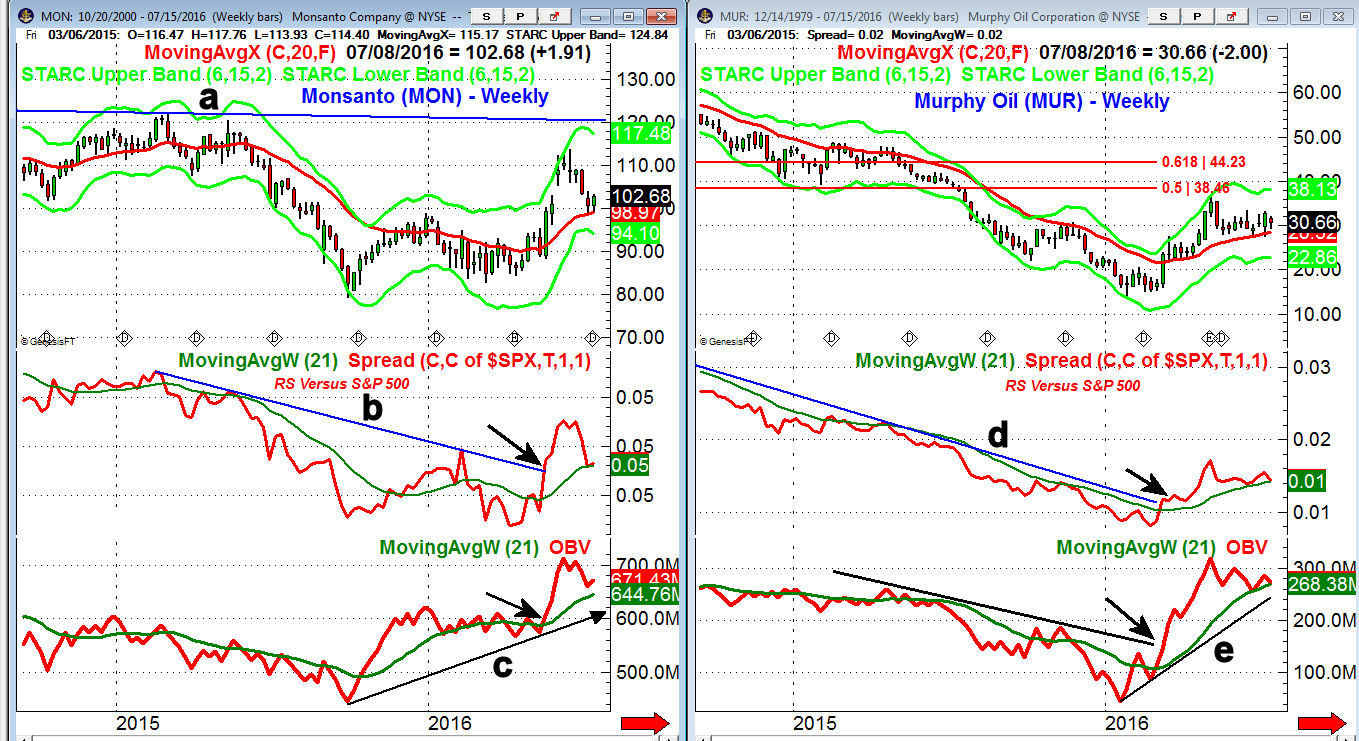
Monsanto Company (MON) closed July 8th at $102.68 which was above the quarterly pivot at $101.04 as it has pulled back to its 20 week EMA. They reported earnings on June 29th. Monsanto Company (MON) has slightly underperformed the Spyder Trust (SPY) YTD as it is up 5.5% versus 6.5%
- The recent correction low at $98.39 was above the 50% support at $98.11 and represented a 13.4% drop from the June high of $113.64.
- The pullback in MON looks like a continuation pattern with an initial upside target at $117.91.
- The quarterly R1 resistance is at $117.21 with major chart resistance, line a, at $120.
- The weekly relative performance bottomed in May as the downtrend, line b, was broken.
- The RS line has just dropped back to its WMA.
- The OBV bottomed in 2015 and was stronger than prices, line c. It has been holding above its WMA on the pullback.
- A daily close above $103.72 will push the daily studies firmly into the buy mode.
Murphy Oil (MUR) after testing its starc+ band at $37.09 in April has pulled back to its 20 week EMA as the four week low has been $27.31. This was a pullback of over 26% from the April high. MUR is scheduled to report earnings in early August and has been much stronger than the Spyder Trust (SPY) YTD as it is up 46.1% versus just 6.5% for the SPY.
- The close on July 8th at $30.66 just below the 3rd quarter pivot at $30.84.
- As of Tuesday's close at $32.10 MUR is above this level which makes Friday's close more important.
- The weekly relative performance broke its downtrend, line d, in early March.
- The RS line has held above its WMA on the correction.
- The weekly on-balance-volume (OBV) formed a bullish divergence at the February lows, line e.
- This divergence was confirmed by the break though the downtrend in early March.
- The daily technical studies have now turned positive with initial upside target at $37.09 and the 1.272 Fibonacci extension targets is at $39.53.
What it Means: Historically it has been unusual to see a sell list from a major brokerage firm or investment bank. The fact that this list was based on fundamental analysis made it even more interesting to me as I believe that technical analysis is much more reliable. In their report Goldman Sachs has a downside target of $92 for Monsanto (MON) and $22 for Murphy Oil (MUR).
A two part-trading lesson on the NYSE Advance/Decline line is sent out to all new subscribers to either the Viper ETF Report or the Viper Hot Stocks Report.
Comments
comments