
Last week’s action in both the stock and bond markets was eloquently summed up by Bloomberg in just two words: Everything Rally. After Fed Chair Powell’s optimistic outlook on the economy during last Sunday’s 60 Minutes interview, many of the Fed's Governors came out in vocal support throughout the week. That, combined with the 9.8% increase in Retail Sales for March and the 19% jump in Housing Starts helped push most of the market averages to new highs.
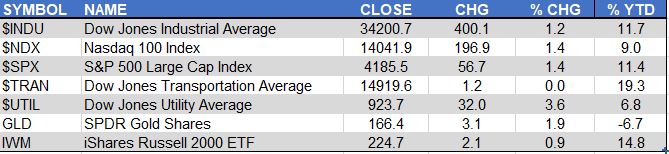

The standout performer was the Dow Jones Utility Average as it rose 3.6%. The gains were broadly based as well, as indicated by the 1.4% gains in the S&P 500 and the Nasdaq 100NDAQ while the Dow Jones Industrial was not far up 1.2%.
Even the SPDR Gold Shares (GLD) had a good week, as it was up 1.9%, outperforming the iShares Russell 2000 (IWM)IWM which was up 0.9%. The bond market ignored the stronger-than-expected economic data, as the yield on the 10 Year T-Note declined sharply to 1.573% after a high on March 30 of 1.767%. The decline below the four-week support at 1.585% makes the next important support level in the 1.400% area.
In January, I focused on the sharp rise in commodity prices and featured a chart of food inflation. Last week’s news release on the Consumer Price Index did catch my attention. In the first paragraph was the comment that the “March 1-month increase was the largest rise since a 0.6-percent increase in August 2012”.
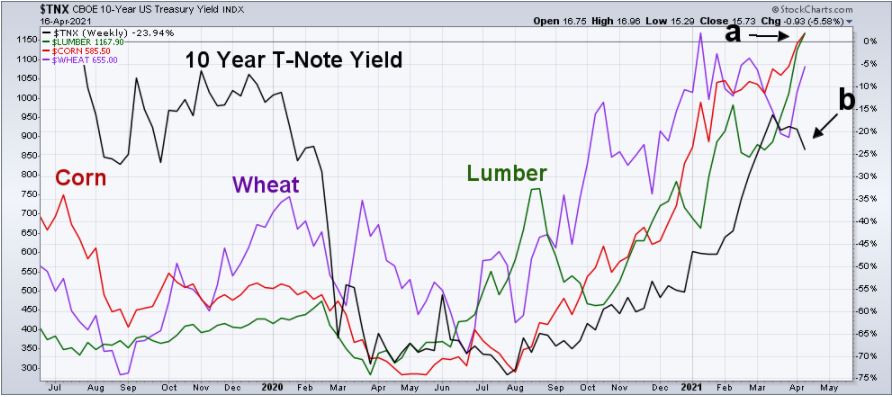
The January analysis indicated there were strong uptrends in many of the key commodities. This has not changed. Corn and lumber prices have just made a new high (point a) and wheat is not far behind. Corn, lumber, and wheat bottomed between April and August of last year, along with the yield on the 10 Year T-Notes. All of the commodities have reached their highest levels since 2015. Lumber, for example, closed last week at $1294, an all-time high. Even at the peak of inflation in 1980, it was only $350.

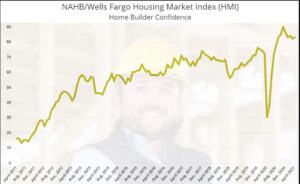
The NAHB/Wells Fargo Housing Market Index (HMI) is a gauge of builder opinion for the next six months and it came in this month at 83. This was just below the November 2020 high of 90, which itself was an all-time high. Of course, the supply of new homes is very tight due to the “cost and availability of lumber, appliances, and other building materials”.

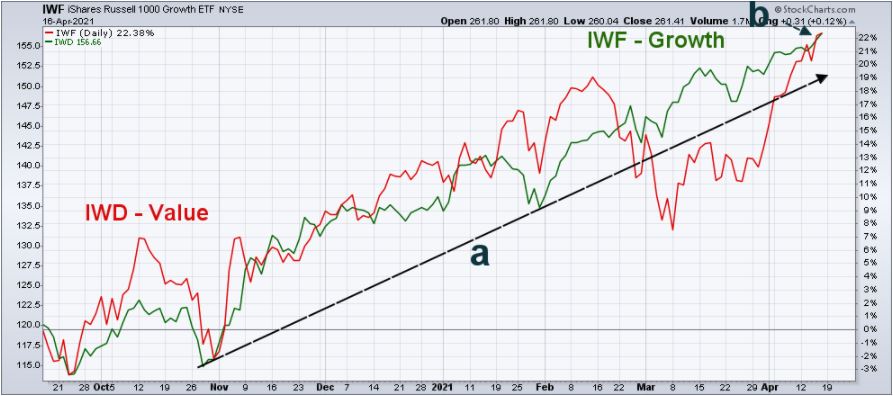
The direction of interest rates and the inflation fears are important in the debate between growth and value stocks. That has come to the forefront over the past three weeks as growth stocks have rebounded sharply.

The iShares Russell 1000 Value (IWD)IWD has been in a strong uptrend since the November lows (line a). Since late March, the iShares Russell 1000 Growth (IWF)IWF has caught up with IWD (point b).
Value's position as a leader was not helped by the market's reaction to the earnings from JPMorgan ChaseJPM (JPM) and Bank of America (BAC) as despite their strong earnings, both closed the week lower.
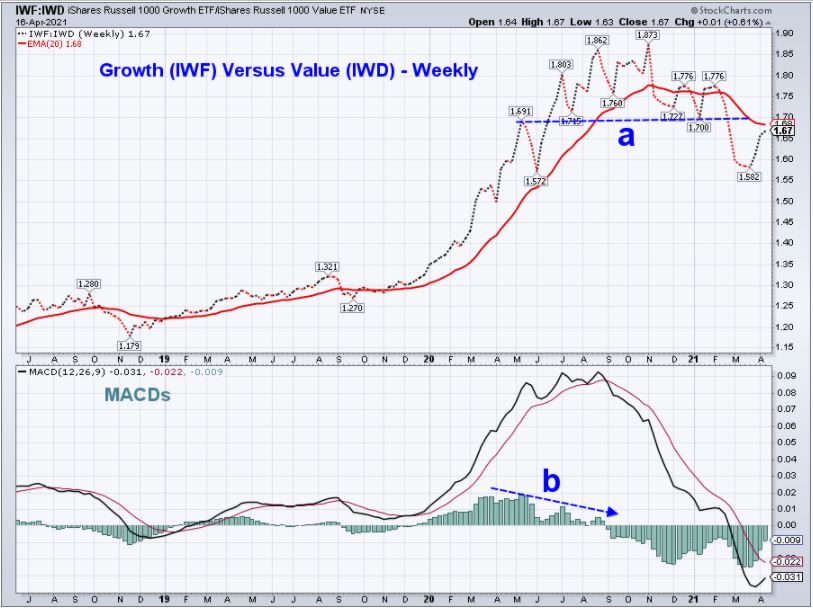
The weekly chart of the ratio of iShares Russell 1000 Growth (IWF) to the iShares Russell 1000 Value (IWD) shows that a top for growth versus value appears to have been formed at the end of February as the support (line a) was violated. The ratio has rebounded and is close to the 20-week exponential moving average (EMA) and the former support, which is now resistance. If the chart formation is indeed a top, that would be confirmed by the ratio turning lower and then dropping below the March lows. However, a rally above the 1.776 level would show that the past few months have just been a correction.

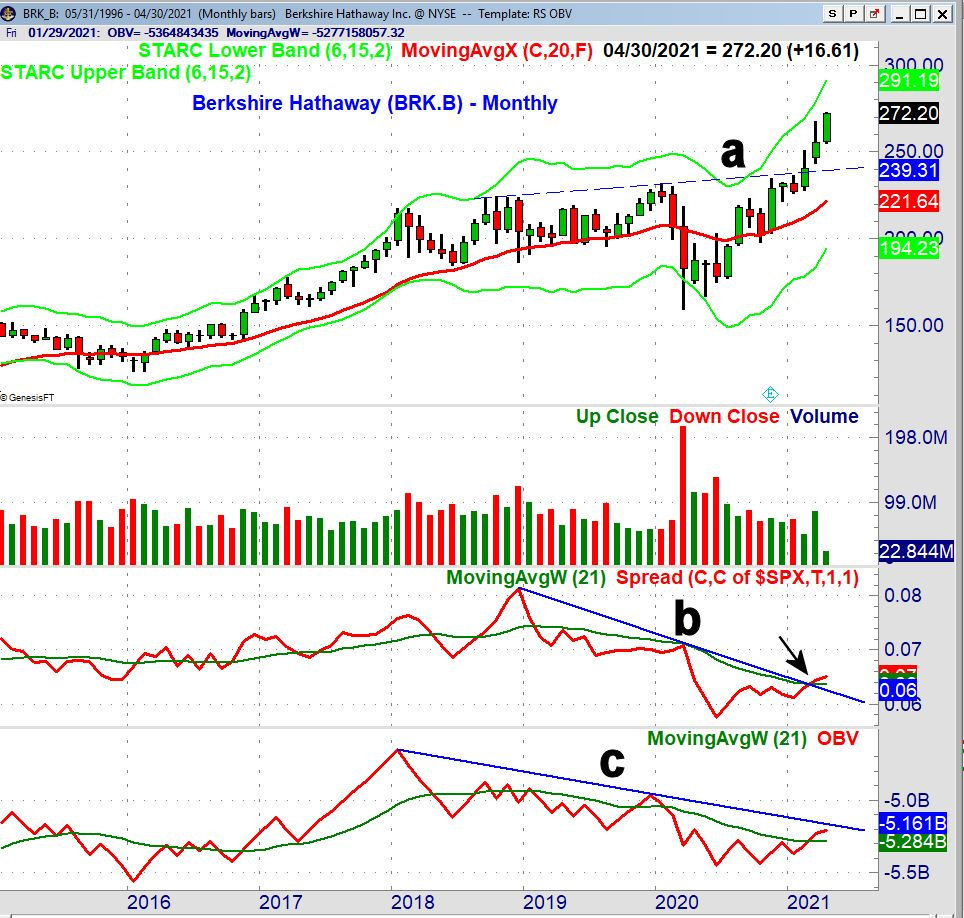
Warren Buffett is the most well know value investor and his Berkshire Hathaway Inc. Class B (BRK.B) is up 17.4% year-to-date. The monthly chart shows that it overcame resistance from late 2018 (line a) in February. It was up sharply in March and is currently 6.5% higher in April.

Berkshire Hathaway's relative performance versus the S&P 500 (RS) has broken its steep downtrend (line b), and moved above its weighted moving average (WMA), but has not yet convincingly started a new uptrend. Its On Balance Volume (OBV) is now above its WMA but is still below its downtrend (line c), which needs to be overcome to support the price action.
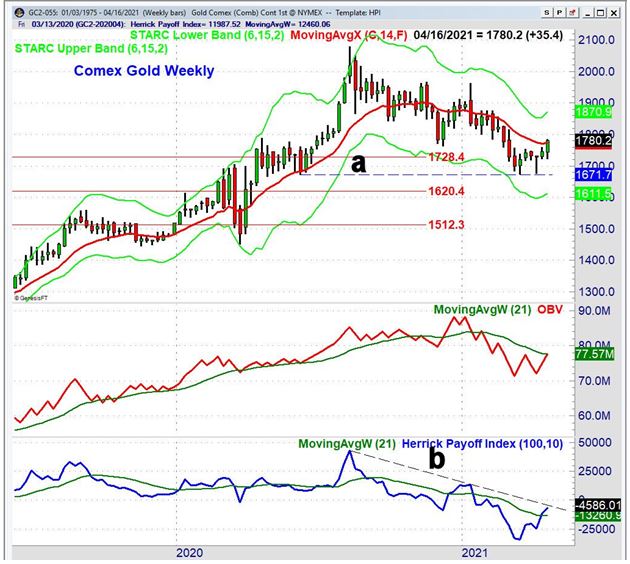
The US dollar was lower last week, and that likely helped trigger a 2% rise in the Comex Gold futures. The futures had bottomed at $1671.7 (line a) which was midway between the 38.2% Fibonacci retracement support at $1728.4 and the 50% level at $1620.4. The close at $1780.20 was just above the 20-week EMA at $1772.4. There is stronger resistance in the $1820-$1840 area, with the weekly starc+ band at $1870.6.

The weekly OBV closed last week above its WMA, but is still well below the resistance from late 2020. The Herrick Payoff Index (HPI) is simply a mathematical method of measuring the money flowing in or out of a commodity by computing the difference in dollar volume. This is accomplished by using the volume, open interest, and price data. The HPI has closed back above its WMA but is still below the downtrend (line b) and is negative.
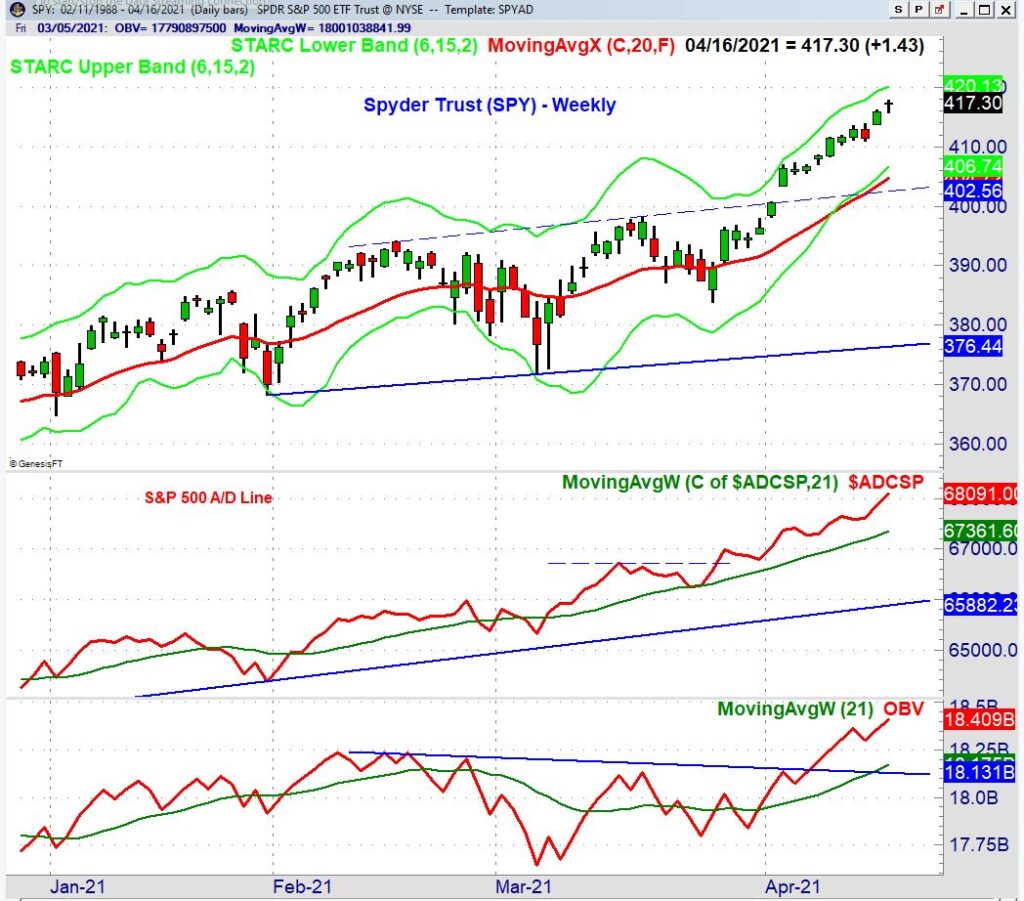
The new highs in the Spyder Trust (SPY) last week were supported by technical studies. SPY formed a doji on Friday, closing at $417.30. The close was less than 1% below its weekly starc+ band, which is an indication that SPY is in a high-risk buy area. The upside targets from the trading range (lines a and b) are in the $420-$424 area.

The S&P 500 Advance/Decline line made another new high last week (line c). This is an indication that any correction should just be a pullback in the major trend, not a significant top. The relatively wide gap between the A/D line and its WMA is a sign that the market is extended on the upside. The OBV for the Spyder Trust broke through resistance (line d) on April 8 and made a new high last week.
As I pointed out last week, the Bullish % in the April 8 survey from the American Association of Individual Investors (AAII) came in at 56.9%, which is the highest reading since January 4, 2018. This, combined with the fact that 91% of the S&P 500 stocks are above their 50-day moving averages and the starc+ band analysis, suggest that some profit-taking this week would be prudent. That does not mean that the SPY can’t rally another 5% in the next few weeks, but a 5% drop is just as likely.
In the Viper ETF Report and Viper Hot Stocks Report, I update subscribers with my market analysis at least twice each week and provide specific buy and sell advice. Each report is just $34.95 per month. New subscribers also receive six free trading lessons, a $49 value.
To learn more about the stock market and investing take advantage of this limited time special offer to spend 90 minutes with Tom.
Comments
comments