The new record high in the S&P 500 got the market’s attention last week. The correction early last week had taken both the S&P 500 and the Nasdaq 100 Index back to their rising 20-day EMA. This is often a good support level for stocks or ETFs in an uptrend.
The strong open Thursday along with the 0.9% gain in the S&P 500 and positive A/D numbers was consistent with a resumption of the market’s uptrend from the late October lows.

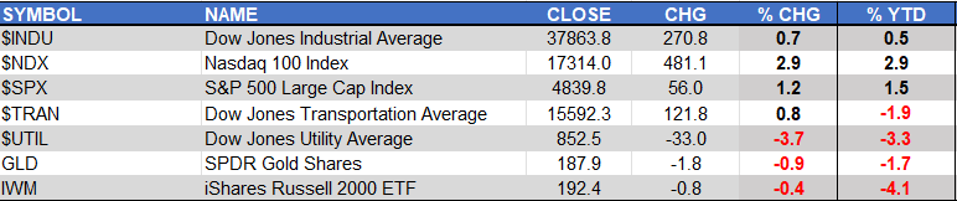
The action in the markets last week was mixed led by a 2.9% gain in the Nasdaq 100 as it made another all-time high. The S&P 500 was up 1.2% but the gains were under 1% in the Dow Jones Industrial Average and Dow Jones Transportation Average.
The selling was the heaviest in the Dow Jones Utility Average as it was down 3.3%, followed by a 0.9% decline in the Spyder Gold Trust (GLD). There was a 0.4% loss for the iShares Russell 2000 even though it closed above the lows.

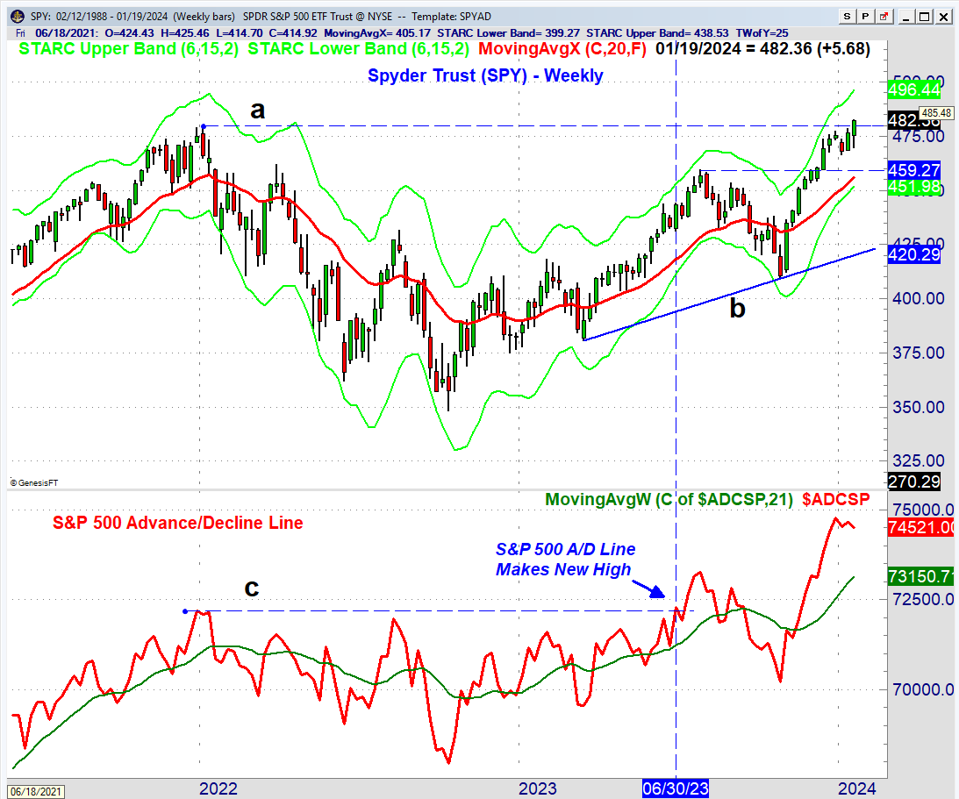
The weekly chart of the Spyder Trust (SPY) that tracks the S&P 500 reveals last week’s close above the 2022 high, line a. The weekly starc+ band is at $496.44 and the three-week trading range has targets above $500. The July high at $459.27 is now important support
The weekly S&P 500 A/D line made a new all-time high in June. As I commented at the time “Based on my approach to advance/decline analysis this is a sign that the SPY will ultimately surpass its prior all-time high.”
I have been using the NYSE Advance/Decline data since the 1980s and have developed a unique method of using it for timing based on the daily, weekly as well as monthly data. Many other technical analysts also use the data but in different ways so their interpretations and mine do not often agree.
Another projection for a new all-time high for the S&P 500 was made in January 2019 when “the monthly S&P 500 Advance/Decline line” made a new all-time high (see chart)
This was after the disastrous market decline in the last quarter of 2018 that dropped the S&P 500 13.5%. Some analysts had projected a new bear market before Christmas but not the advance/decline line analysis.

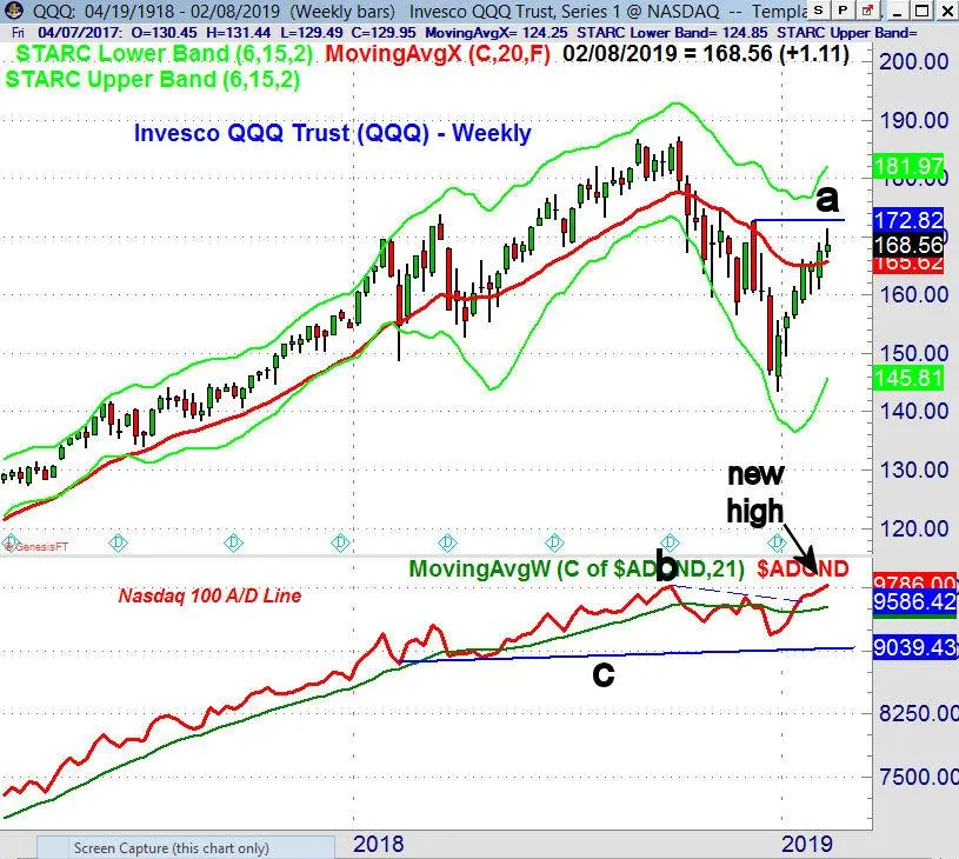
The week ending February 8th of 2019, this chart shows that the Nasdaq 100 Advance/Decline line also made a new high as the Invesco QQQ Trust (QQQ) closed at $168.56. This action projected a move above the November 2018 high at $184.48 which was 9.4% above the close. That high was overcome in April 2018.

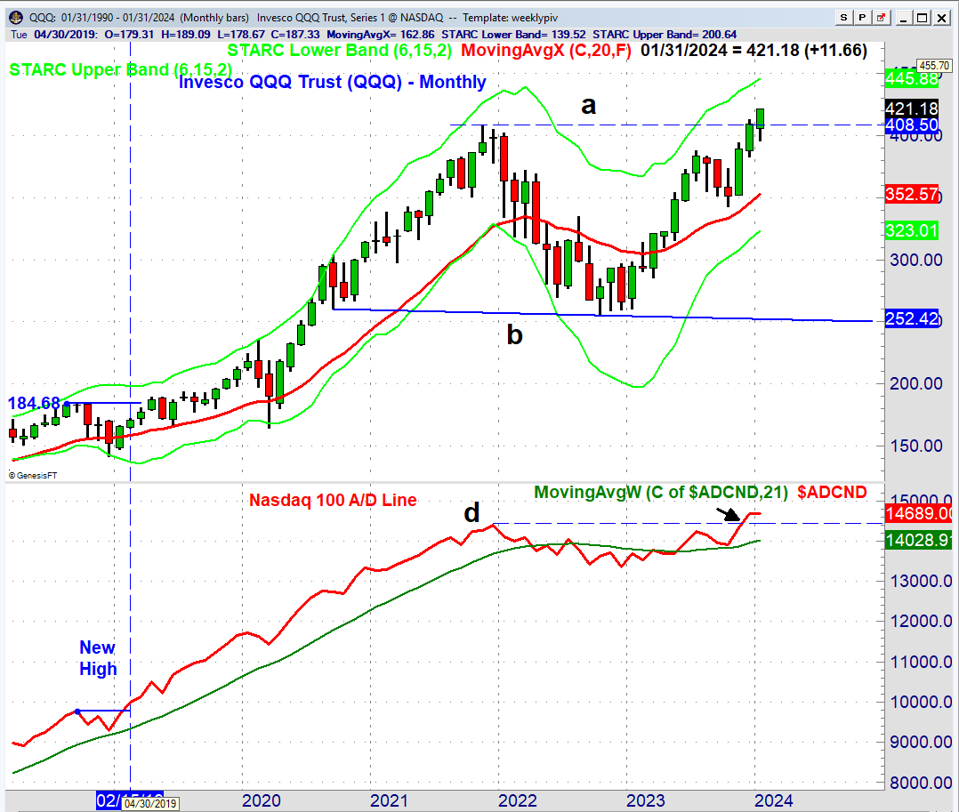
The current monthly chart of the QQQ shows that a new high was made in December and a close at the current level at the end of January will reinforce the bullish completion of the monthly trading range. The monthly Nasdaq 100 A/D line made a new high in December as it closed above the late 2021 high, line d.
This action favors higher prices as we head into February but there are likely to be periodic near-term corrections like last week. As discussed last week there are always new reasons from other analysts why not to buy stocks like there were at the start of 2023.
For those wanting to invest in sector ETFs the selection process that I discussed last week may be beneficial.
Students of the advance/decline analysis can find my articles going back to 2011 in the Forbes.com archive. There you can review the A/D line analysis at other key turning points. Non-subscribers may be limited to a fixed number of articles.
For one-on-one training with Tom - Get a Competitive Edge
Comments
comments