

Stocks closed strong in September but the market started to show signs of weakness on the first trading day of October.
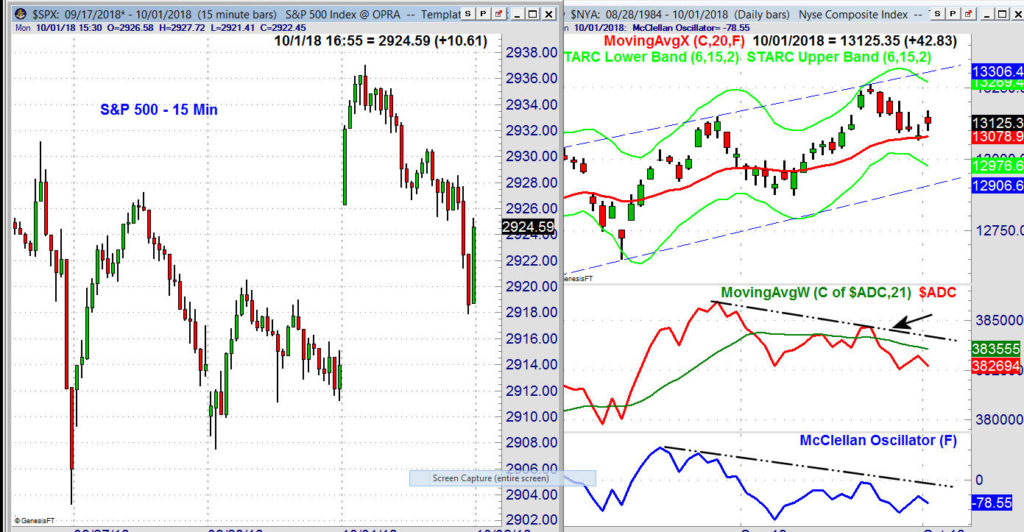

Market Update October 2, 2018: The major averages opened sharply higher on Monday October 1st as the A/D ratio on the NYSE was better than 2-1 positive. However, as the day progressed the major averages declined steadily from their highs. Most did close the day higher except for the small-cap stocks which were hit hard and the biotech stocks were also lower.
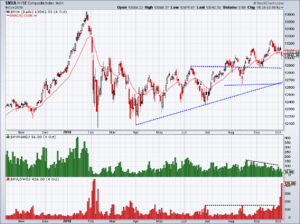
The daily chart of the NYSE shows that even though it closed higher for the day the A/D line was lower and is still well below its declining WMA. The daily stock only A/D line was also lower Monday and is below its WMA. The McClellan oscillator is still in a downtrend.
Viper ETF Report - October 3, 2018
Tuesday’s stock market performance did not resolve the short term concerns for the market after Monday’s reversal. The Dow was up 0.46% on Tuesday while the Russell 2000 was down 1%. The S&P 500, Nasdaq 100 and NYSE were all a bit lower. There were 1178 stocks advancing with 1891 declining.
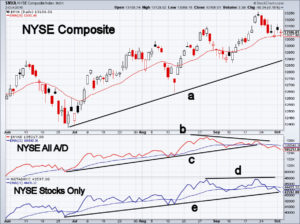

The NYSE Composite has been testing the 20 day EMA after making a new high on Sept. 21st. At that high as I have pointed out before the all stocks, NYSE A/D line did not make a new high, line b. The uptrend from the July lows, line c, was broken last week. The NYSE stocks only NYSE A/D line did make a new high with prices, line d, and is now testing its uptrend line e. The McClellan is in a downtrend and closed at -104.
NYSE New Highs which is still in a solid downtrend line b. It would take more than 136 New highs to break the downtrend. The New Lows shows a rising trend, line c. On Tuesday there were 148 New lows and 43 New Highs.

Market Update – October 5, 2018
The weakness warning from Monday ‘s reversal came due on Thursday as stocks were hit hard for most of the day though did close off the lows. The market internals on the NYSE were 4-1 negative and a whopping 425 NYSE stocks made New Lows. The McClellan oscillator is now more oversold at -174.
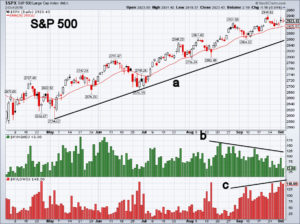
The S&P 500, Nasdaq 100, NYSE and Russell A/D lines are now below their WMAs while the Dow A/D line is holding above its WMA. Only the weekly Russell 2000 A/D line will close the week below its WMA.
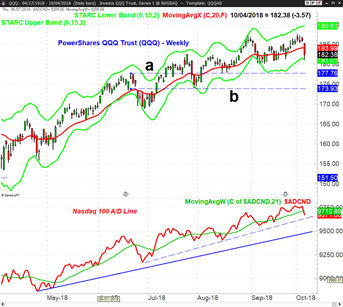

The daily chart of the QQQ shows that the daily starc- band was also tested on Thursday. There is next strong chart support in the $177.76 area line a. This is 2.5% below Thursday’s close. The Nasdaq 100 A/D line is below its WMA but is still above both levels of trend line support.
The sharp rebound on Friday October 12th was predicted by the very one sided selling on Wednesday - but should you be taking action on this rally?
Comments
comments