
As the stock market struggled to move higher last week, it was pummeled by news out of Washington D.C. that kept investors on edge every day. Even on Friday, as the market was struggling to move higher, there were new rumors about who might next leave the White House’s revolving door.
There was also the appointment of Larry Kudlow to head the Economic Council. Never trained as an economist, it is Trump’s hope that Kudlow’s TV experience will be a confidence booster. As one publication commented, “Kudlow isn't an economist, but he plays one on TV.”
Many in the conservative press lauded his appointment, but in a Bloomberg review “Kudlow’s Best and Worst Calls, From No 2007 Recession to Trump Bump”, there were plenty of reasons to question whether his advice would be guided by objective analysis of the data or a strict adherence to a conservative dogma.


As the article points out, he was dead wrong on the housing market in May 2015, just before prices were peaking. A quick look at the chart for the the S&P Homebuilders Index shows a classic head and shoulders top formation at this time. In this formation, you'll see a Left Shoulder form as the market rallies and then returns to test support, and then form a head as the market rallies higher but again drops down to the prior low (line a) which is called the neckline.
The failure to reach the prior high on the third rally creates the right shoulder (RS) and then the break of support (line a) completes the top formation. In this instance the support going back to 2003 (line b) was also broken, which was another big sign of weakness. By taking the distance from the neckline to the price high, you can then determine the downside price target. This gave a target in the 2700-area that was reached in the summer of 2007. The index eventually dropped below 1000.
It doesn't seem that he ever changed his view on housing, as in February 2009, he was still advocating a “free-market economics 101” approach to the problem, as he thought the markets were already “solving the housing problem.” After nine years, the home prices in some cities are still below the highs made before the recession.
Even more alarming was his failure to recognize the signs that the economy was weakening. In his December 2007 article, “Bush Boom Continues”, he commented that “Despite all the doom and gloom from the economic pessimistas, the resilient U.S economy continues moving ahead 'quarter after quarter, year after year' defying dire forecasts and delivering positive growth. In fact, we are about to enter the seventh consecutive year of the Bush boom.”
This was despite the fact that, from a technical perspective, the bull market had ended, and most of the key economic measures of economy had dropped to levels that were consistent with the start of a recession.
Like most of the Republican establishment, he warned in 2010 that Yellen is “spellin’ future inflation.“ The warnings continued through many years of the bull market, as did his concern over the dire consequences of the budget deficit. His recent comments indicate that this is no longer a concern.
It is not really his many incorrect forecasts that worry me, as much as it is the stubbornness that he has exhibited in his approach. There is little evidence of him ever changing his opinion even when the evidence was overwhelming. The long battle to overcome the last recession should have convinced him and others that the economy does not adhere to a fixed set of rules.
Many did not believe in the Fed’s monetary expansion in the early years after the recession, and still do not now, even though the economy is finally booming. It is clear that the Fed did not initially believe that they would need to keep rates low for as they did, but they kept reacting to the data until the economy finally turned.
This required a flexible approach to the economy. In my experience this is also a key trait of successful investors and traders. Those who guide their investments using fundamental data often have more trouble changing their position than do those who use technical analysis.
Successful technical analysts objectively weigh the bullish and bearish factors to determine the “weight of the evidence”, a term coined by the esteemed technical analyst Stan Weinstein. The failure to acknowledge the evidence on both sides and use stops has wiped out many investors as well as traders.
I have often had investors tell me that a stock was a long term holding that they would never sell because of their long term faith in the company’s prospects or their business model. When asked if their opinion would change if the stock dropped 30%, the common response was that it simply could not happen.
Stubbornness and a lack of flexibility are major problems of investors, as many get “married to a position” and do not consider selling until it is too late. This is what destroyed many value investors in the financial stocks during the bear market, as fundamentally, they looked cheap, but they then got much cheaper. Bank of America fell from $45 per share to under $3.


Many traders and a large number of investors focus on earnings, which in my view often top out after the stock price. The chart of Tractor Supply (TSCO) from Market Trends shows that earnings have been increasing since 2014 (line a). The earnings actually bottomed in the summer of 2010 when the stock was trading in the $16 area.


The relative performance (RS) had indicated that TSCO was a market leader early in 2010. The weekly OBV had also turned positive by the end of the year (line 1). The RS held above support (line a) during the 2014 decline, but then topped out in August 2016, as the stock had reached $94.33 a few weeks earlier. The OBV also turned negative at the same time (line 2).
TSCO subsequently dropped below $50 a share in July 2017. At the low it was down 47% from the highs even though earnings kept improving. Even those who thought TSCO was a long-term hold likely gave up during this steep drop. A well-placed stop on their position or a decision to sell could have helped them avoid much of the decline.
This is why the successful adviser and investors must be flexible. Those who are not flexible stay with a losing position too long or get caught on the wrong side of a market because they fail to admit their analysis was wrong.
All successful advisers, investors or traders are wrong some of the time, myself included. The financial markets are often humbling to experience, and I learned early on that risk management and stops needed to play an important role in my analysis. I generally limit the risk to 5% or less in any position, and once it moves in my favor, the stops are raised to reduce the risk. When I am wrong, and the position is stopped out, it is a sign that my original analysis may be wrong. It therefore forces me to be flexible, and to question the basis for my original buy or sell decision.
In my ETF and stock recommendations, I use hard stops that are rarely adjusted downward. Very early in the recent market plunge, I realized it was possible that some stops might be hit before the selling was over.
I carefully examined each holding and determined that the major trends had not changed, and therefore recommended pulling stops on some of the ETF positions. My analysis of the selling made me confident that the market would rebound (Are The Wall Street Strategist Finally Right?).
In fact, new longs were actually established when the market opened on February 12th. As the market rebounded strongly, stops were again put back in the market, and many were raised as the market moved even higher. One of the Viper ETF favorites, the Technology Sector Select (XLK), has returned 12.6%, including reinvested dividends since the correction low.
Though my short term analysis (see below) is still positive, it needed a higher close last week to further support the bullish case and to indicate that a bear trap had formed. I was looking for a pullback last week, but thought it would be over by the end of the week. The Dow Industrials, S&P 500, and small cap Russell 2000 were up on Friday, but the Nasdaq 100 was lower.
For the week, the Dow lost 1.54%, and was weaker than the S&P 500, which lost 1.24%. The small cap indices did much better that the S&P, while the Dow Utilities managed to gain 2.91%. The weekly NYSE A/D numbers were negative as 1205 stocks rose but 1866 declined.


The daily chart of the Spyder Trust (SPY) shows the nice rally from the February low (line b). The close was also just above the 20-day EMA at $272.90, with strong resistance now in the $280 area. The S&P Advance/Decline line also shows a solid uptrend from the lows (line a) and it turned up from its WMA on Friday, which will be a clear positive sign if we observe a higher close Monday.
The bullish scenario, which is consistent with the fact that the weekly A/D lines are all above their rising WMAs, is that prices will now accelerate to the upside as indicated by the green arrow (line 1). One could also look at the chart formation as a rising wedge (lines a and b) which could be completed by a sharp break to the downside (line 2). This would make the recent low at $263.76-$265 the key level of support. A drop below this level would turn the focus back on the February lows.
Some advisers do not always keep an open mind. I have heard several lately that are only focused on the various scenarios for when and how (not “if”) the market will top out. They ignore the possibility that the current rally will continue and that the positive major trend has resumed. This leaves their clients unprotected if something occurs outside their limited scenarios.


The NYSE Composite traded in a narrow range last week, as it closed just above the flat 20-week EMA at 12,742, but has not been able to overcome the high from three weeks ago at 13,018. The other major averages have moved above this high. The weekly starc+ band is at 13,425, with important support now at 12,391. The weekly A/D is still holding above its rising WMA and the support (line a), while the daily A/D shows a stronger uptrend.


Once again last week the small cap iShares Russell 2000 (IWM) performed the strongest, and Friday’s close suggested the pullback could be over. The key resistance (line a) is at $160.62. The 20-day EMA is at $155.49, with further support in the $153-$154 area (line b).
The Russell 2000 A/D line is in a strong uptrend (line c) and turned up on Friday. It could make a new high this week with some positive action. The relative performance broke its downtrend early in the month (Is It Time To Rotate Into The Small Caps?) and continues to signal that it is a market leader. The weekly RS (not shown) is also positive, as it has moved above its downtrend.


The daily chart of the PowerShares QQQ Trust (QQQ) also supports the bullish case. It has been the best performer since the February lows, making convincing new highs on Tuesday before it reversed to close lower. The QQQ has just pulled back to the breakout level (line a) and has held above the 20-day EMA at $168.90.
The Nasdaq 100 A/D line made a new high with prices last week and has also pulled back to the breakout level (line b). It is above its WMA and the positive pattern (line c) supports a bullish conclusion.
The economic data last week was generally quite good. Tuesday’s CPI report put the market at ease, as it came in at 0.2%, down from 0.5% in last month's report, which had caused many investors to stay on the sidelines in advance of its release.
The Retail Sales and Housing Starts were both weaker than expected, but Industrial Production was much stronger. After the market’s correction, I was especially interested in the mid-month reading on Consumer Sentiment, which at 102 was well above the February reading of 99.7.
This week, the focus will be on the FOMC meeting that begins on Tuesday, as many are expecting them to raise rates. The Leading Indicators (LEI) is out on Thursday.


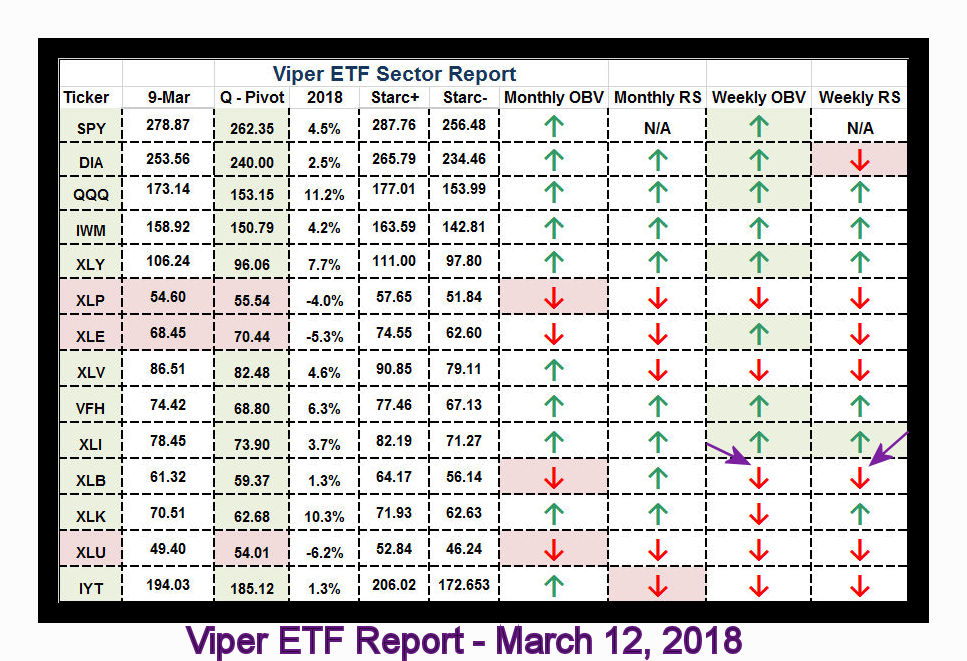
What to do? The risk in some of the ETFs is quite high currently, as many are 8-10% above their recent lows. The systematic weekly analysis of the key sectors warned last Monday that the relative performance and OBV analysis on the Materials Sector Select (XLB) were both negative (see arrows). The materials sector was the weakest as it dropped 3.3%.
There are still more stocks that are coming out of tight trading ranges or have corrected back to major support. This allows for good risk control on new positions, which is essential.
If you are interested in specific buy and sell advice, I hope you will consider the Viper ETF or Viper Hot Stocks reports. Each is sent out twice a week and the reports are only $34.95 each per month.
Comments
comments