

As we start a new quarter, it is time to determine whether the quarterly pivots can help one navigate what was a frustrating market for many investors and most traders.

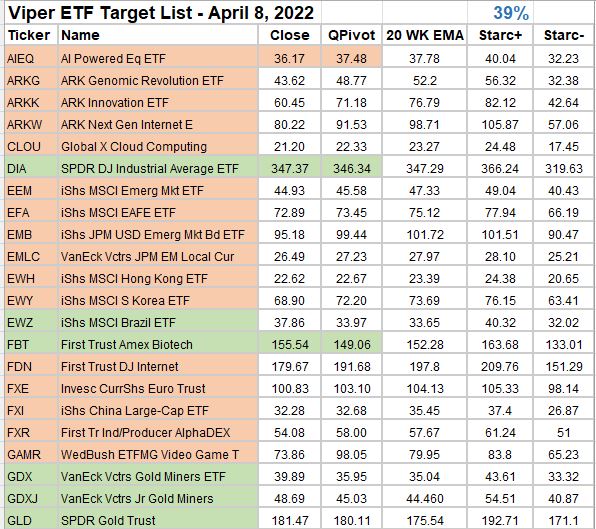
The rather simplistic approach that I use is to watch whether a market average, stock, or ETF has a weekly close above or below their quarterly pivots. These reports are sent out each weekend to Viper ETF subscribers. Above is a screenshot of just the first page of the report from April 8, 2022 that covers 118 ETFs
I also use these pivot levels as a unique support and resistance levels. Sometimes, the quarterly levels will also correspond to weekly or monthly starc bands, which suggests that this level is even more important.
The support and resistance levels are valid through the end of June. If you would like to learn more about this type of analysis email us at wentworthresearch@gmail.co for a copy of this trading lesson. Just put QPivot in the subject line

Comments
comments