

Tuesday's 1.2% decline in the S&P 500 and 10% rise in the VIX certainly got the market's attention as it was already nervous about the health care vote. The financial media debated the impact of both a No and a Yes vote but cancelling the vote was clearly not expected.
Of course this has started a new debate as some think it means that Trump's poor understanding of the legislative process dooms the rest of his legislative agenda while others think it will have little impact. Though the health care debacle will not help the Republican brand I would expect them to be much more organized and effective on tax reform.
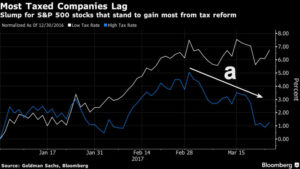

Some investors do not seem as convinced as this Bloomberg chart shows that those companies with a high tax rate have not done well this month. This basket of stocks peaked in late February and have been declining every since, line a. As the chart indicates those stocks with a low tax rate have done much better.
The lowering of tax rates is one of the driving force for both the professional and individual investors. According to AAII individual investors were a bit more bullish last week at 35.3% which was an increase of 4.1% while the bearish % fell 8.2% to 30.5%.
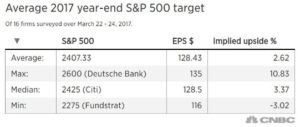

There was an increase in the bearish commentary from the financial media after Tuesday's drop while many Wall Street strategists have raised their upside targets for the S&P 500. As detailed by CNBC "four of 16 market strategists CNBC surveyed in the last three days raised their S&P 500 targets for the year-end or next 12 months."
This is not normally a good sign as when strategists keep changing their forecasts to keep up with a steadily rising or falling market it often coincides with an interruption in the major trend. Many will remember that after the continued slide in crude oil prices in early 2015 many energy experts kept lowering their crude oil targets just before it rallied $20 per barrel.
When examining the stock market I look at the A/D line analysis of three main time periods monthly, weekly and daily. For long term investors I have always stressed that they should be long stocks until there are warning signs of a new bear market or there are signs of a recession.
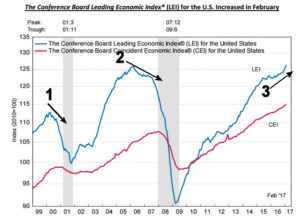

As I noted last week the Leading Economic Indicators (LEI) rose 0.6% in February to a ten year high. As I have pointed out in the past it has a good record of topping out before the start of a recession. That was the case in 2000 (line 1) and the LEI was declining in early 2006 which was well ahead of the financial crisis. The LEI is currently in a strong uptrend, line 3, so there are no warnings of a recession.
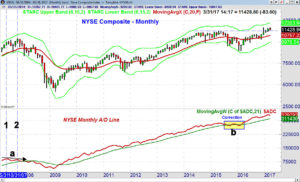

For long term investors I turn to the monthly chart of the NYSE Composite and the NYSE A/D line. Prior to the last bear market it gave plenty of warning before the market topped out in October 2007. The monthly A/D line peaked in May 2007 (line 1) and then formed a lower high in October 2007, line 2. This negative divergence, line a, was subsequently confirmed in early 2008 as a new downtrend was confirmed.
Early in the summer of 2015 the monthly A/D line had deteriorated which warned of a correction. This was discussed in more detail in July (Should You Trust This Rally?) as I concluded that "the weight of the evidence indicates this is a rally that you cannot trust".
This warning was followed by the sharp drop in August 2015 and then early in 2016 as the A/D line was in the correction mode (b). The A/D line analysis turned positive in late February and the monthly A/D line made a new high in May.
The monthly NYSE A/D line is still clearly positive as it made a new high in February and is well above its WMA. Before the monthly A/D line could form a classic top it would require a sharp market decline followed by another push to new highs.
This means that the stock market is not on ice that is thin enough to indicate a new bear market. Therefore I expect stocks to survive Trump's big legislative failure but as I discuss in the Market Wrap section a further correction is now more likely.
The stock market has become more split in the past month as the energy and small cap stocks have been acting much weaker than the Spyder Trust (SPY). Crude oil is down 11% this month and while lower energy costs are generally a positive for the Dow Transportation Average it is down over 5% in March.
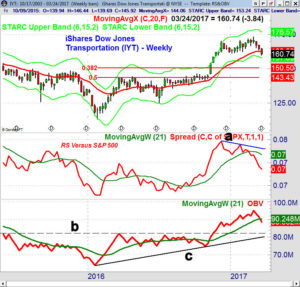

The weekly chart of the iShares Dow Transportation Average (IYT) shows that is has dropped for the past three weeks and is trading below the prior three month lows. There is next support in the $157-$160 area with the 38.2% support at $150.50.
The relative performance did form lower highs, line a, and this divergence was confirmed by the drop below its WMA in late February. This was a sign that IYT was no longer leading the S&P 500. The on-balance-volume (OBV) has dropped below its WMA and may decline to the converging support (lines b and c).
The weak action of the IYT confirms that even in a strong market and in an improving economy one still needs to be selective and to only choose market leading ETFs or stocks.
The Economy
The data on the economy last week continued to support the view from the Leading Economic Indicators that the economy is strong and improving. The Chicago Fed National Activity Index at 0.34 confirmed that "February was a good month for the economy ".
Though Wednesday's Existing Home Sales were down 3.7% the New Home Sales Thursday were up 6.1% well above expectations. Durable Goods were also better than expected while the flash PMI Composite was a bit lower than the consensus view.
There is plenty of economic data this week as the Dallas Fed Manufacturing Survey is out Monday followed Tuesday by the S&P Corelogic Case-Shiller Housing Price Index, Consumer Confidence and the Richmond Fed Manufacturing Index.
The most widely watched number for the week may be Thursday's final reading on 4th quarter GDP followed on Friday by the Chicago PMI and Consumer Sentiment.
Interest Rates & Commodities
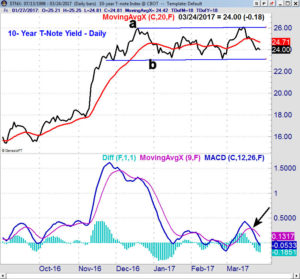

The yield on the 10-year T-Note dropped sharply last week, closing at 2.400% down from 2.500% the previous week. This has taken yields back within the daily trading range, lines a and b. A close below 2.300% would be a downside break with next good support in the 2.200% area. The MACD-His is negative as it reversed to the downside last week consistently with the weak momentum.
Though crude oil was down 2.8% last week both the Spyder Gold Trust (GLD) and the VanEck Gold Miners (GDX) were higher. This was consistent with the positive technical readings for GDX that I pointed out last week.
Market Wrap
It was the roughest week for stocks since last September as the Dow Industrials lost 1.5% just a bit weaker than the S&P 500. The losses were even worse in the Dow Transports, down 2.4% while the small cap Russell 2000 was down 2.7%. Once again the Dow Utilities bucked the trend as it gained 1.3%.
On a weekly basis the declining stocks led the advancers by almost a 2-1 margin. For the week both the financial stocks and industrials lost over 2% while the materials along with the energy sector were not far behind. The technology stocks did better down just 0.8%.
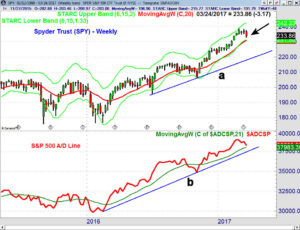

The Spyder Trust (SPY) closed below the prior week's doji of $235.17 which triggered a weekly doji sell signal. The rising 20-week EMA and starc- band are now in the $231.50-$230.78 area. This is just over 1% below current levels. There is more important support in the $225-$228 area.
The weekly A/D did confirm the new high in early March which is a positive for the intermediate term trend. The A/D line did drop further last week and is in a short-term downtrend as it approaches the gradually rising WMA. The weekly OBV (not shown) is still above its rising WMA.
The SPY tested its daily starc- band last week so a bounce cannot be ruled out this week. The daily S&P 500 daily A/D line dropped below its WMA and is now in the corrective mode.
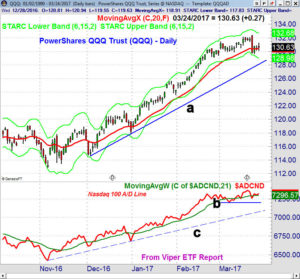
The technical outlook looks more positive on the PowerShares QQQ Trust (QQQ) as it was down 0.8% for the week as it closed just above the flat 20 day EMA at $130.42. The daily starc- band is at $128.98 with the monthly pivot at $128.53.
The Nasdaq 100 A/D line made a new high on March 17th and closed the week above its flat WMA. A decline in the A/D line below the March lows, line b, would be more negative and signal a deeper correction. The A/D line has longer-term support at line c.
The VIX bounced last week but it now needs a close back above the 14 level to signal that a short-term bottom is in place. This would be a negative for stocks and a daily close in the VIX above 16 would be more bearish.
What to do? As I commented in last week's column "A sharply lower close on widely negative A/D numbers however would be enough to signal a deeper correction before the market moves higher." This is unlikely to change the intermediate term trend but should increase the negative sentiment.
The previous correction was an opportunity to do some light buying in a low cost broadly diversified ETF. A stronger correction is now looking more likely and this should be an opportunity to do more aggressive buying.
As I noted to Viper ETF subscribers the global market are now looking more attractive and a few weeks ago the iShares Core MSCI EAFE (IEFA) was recommended. It has a yield of 2.8% with 2528 holdings and an expense ratio of 0.08%. The ETF has 61.4% in greater Europe and 37.3% in Greater Asia.
It is up 3% in the past month and is a bit over extended on a short-term basis. My regular weekly analysis of country ETFs has highlighted some other good overseas opportunities.
Viper Hot Stocks traders took some profits last week and stops were raised in order to protect profits in case of a deeper correction. There were a number of new stocks that have shown up on the sell list after last week's action.
Both the 4-5 page ETF and Stock reports are sent out twice a week and each report is only $34.95 each per month. New subscribers also receive the five most recent Trading Lessons and subscriptions can be cancelled on line at any time.
Comments
comments