
The new closing low in the NYSE Composite on September 28th increased the bearishness of many analysts as investors were still trying to recover from the plunge in late August. Headlines like "Key Global Equity Index Has Fallen Off The Precipice" the following day likely caused more panic selling as the NYSE dropped below the prior day's low.
The stock market bounced on the last trading day of September and then continued higher on October 1st before the sellers took over early on Friday October 2nd. The S&P futures were down 34 points as the weak jobs report triggered further selling. Many analysts were now looking for a drop well below the August 24th lows.
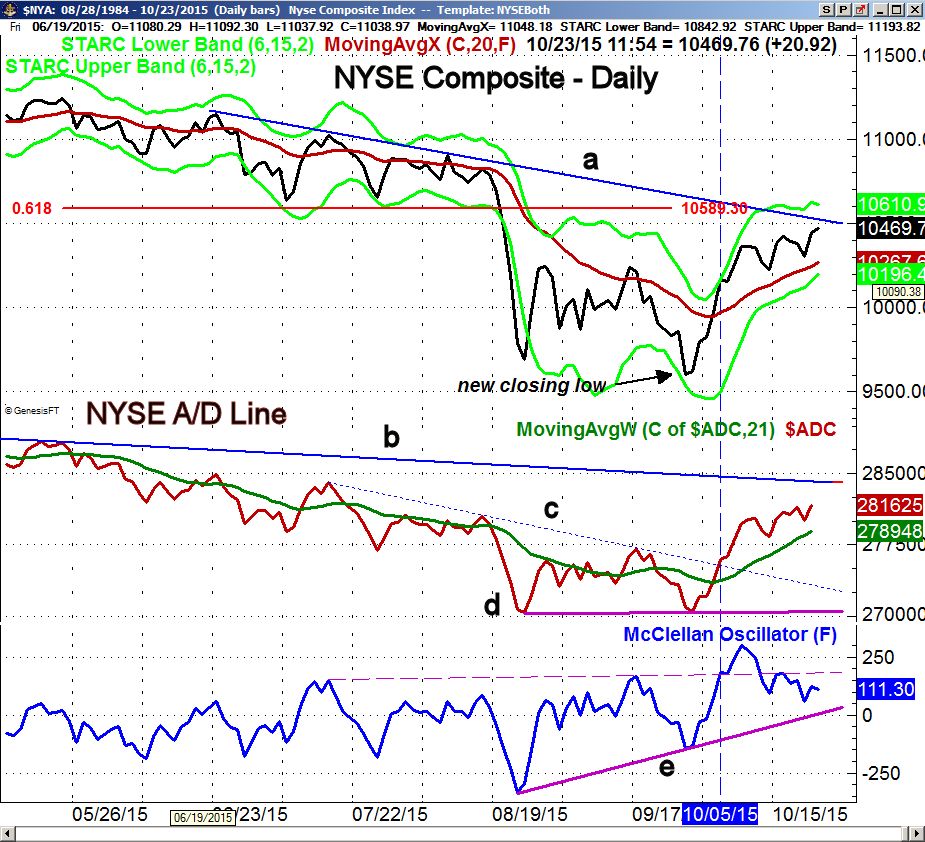
Instead the market reversed to the upside as the S&P 500 closed 60 S&P points above the day's lows. In Saturday's Week Ahead column I explained "Why Friday's Reversal Was Important". In my analysis I pointed out that the new closing low in the NYSE on September 28th was accompanied by higher lows in both the NYSE A/D line (line d) and the McClellan oscillator (line e).
The strong close on October 5th was accompanied by strong market internals which moved the A/D line through its downtrend, line c. After Friday's close this was the technical action I was looking for in order to signal that the market had made an important turn. The steepness of the rise in the A/D line also supported a bullish outlook.
The NYSE Composite is now quite close to the daily downtrend, line a, and the 61.8% Fibonacci retracement resistance at 10,589. The daily A/D line has continued to make new highs with prices and a move through the major downtrend, line b, would be another positive sign. The McClellan oscillator has not made a new high in the past week but is still above the support at line e.
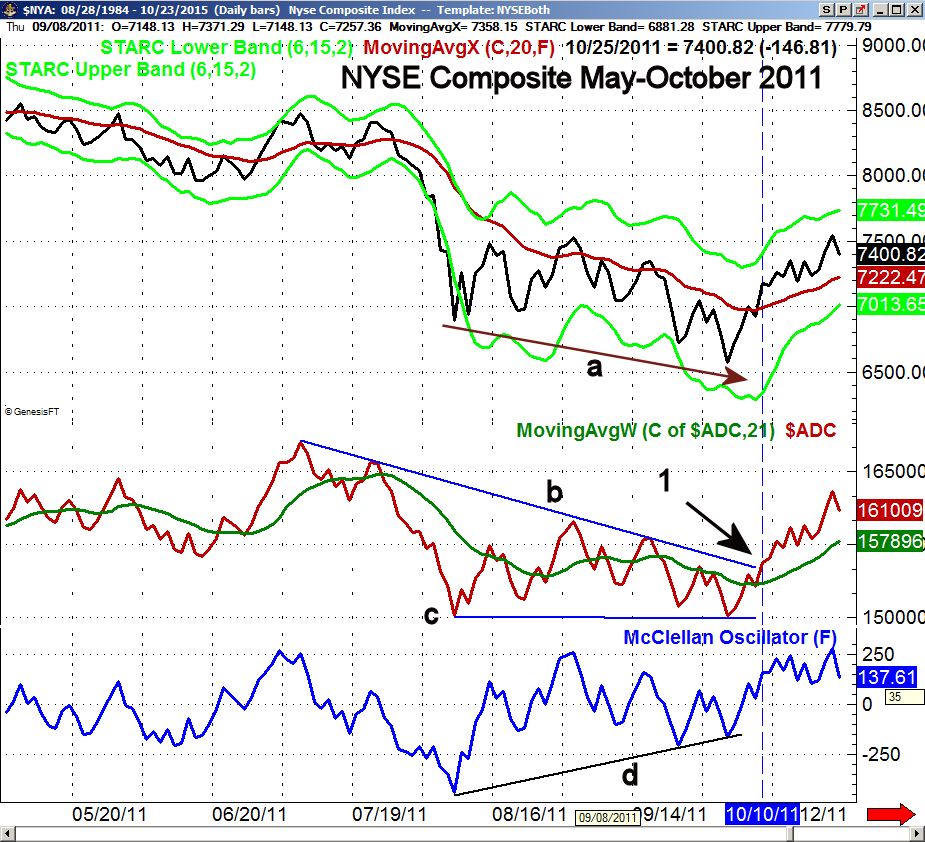
In order to confirm that a price reversal is important the price action must be supported by the action of the market internals and the A/D line. As the market was correcting in August I wondered if the market decline would look like that of 2011 or 2012. The market has now answered that question as the technical evidence is quite similar.
On October 3rd 2011 the NYSE Composite made a new closing low, line a,. The next day there was heavy selling on the open as the NYSE Composite dropped another 140 points before reversing to the upside, closing 150 points higher on the day and volume was heavy.
Both the NYSE A/D line and the McClellan oscillator made their lows in August 2011 and formed significantly higher lows in October, lines c and d. As was the case this year these bullish divergences indicated that at the new closing low, there was less selling. The divergences were confirmed on October 10th as the downtrend in the A/D line was overcome, point 1. As I said at the time "Be Bold, Be Fearless... Buy the Dip"
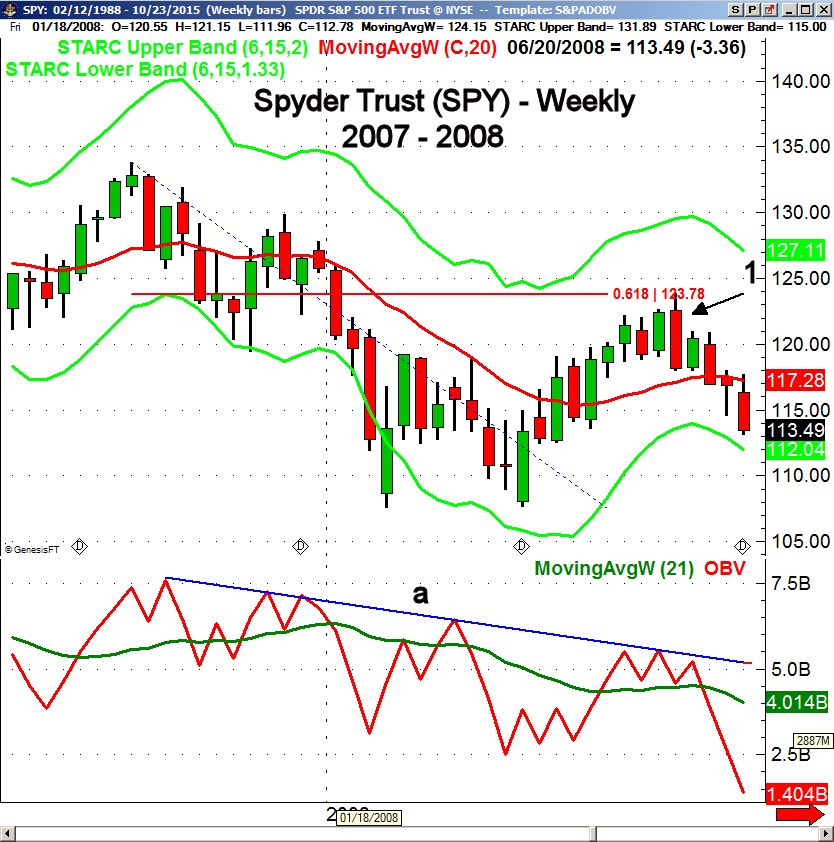
Of course investors also need to gain the skills necessary to recognize important downside reversals. After the bull market top in October 2007 the Spyder Trust (SPY) declined from a high of $133.81 to a March low of $107.67. The NYSE A/D line had peaked mid-way through 2007 and had formed multiple negative divergences before the market topped out.
The rally from the March low just rebounded back to the 61.8% Fibonacci retracement resistance at $123.78. The week ending May 23rd the SPY made a new rebound high at $123.85 before reversing to the downside and closing near the lows at $118.13.
The close was also below the prior three week lows. The OBV just rallied back to its downtrend, line a, during the rally which was a sign of weakness. A week later the daily NYSE A/D line had confirmed a top consistent with my view that this was a bear market rally.
Since the October 2nd low the sentiment has seen a gradual change as on October 5th one often quoted trader commented that the "markets appear to be have rallied a bit too far, too fast." Other analysts maintained their skepticism as the following headlines indicate.
Stocks: A Bear Market Until Proven Otherwise?
The Stock Market Correction Is Not Yet Over”
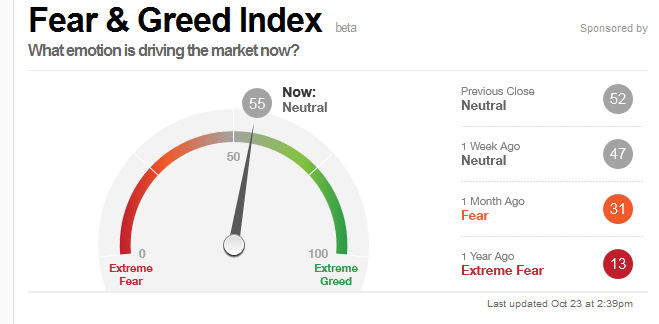
Now that we are approaching the end of the month and the stock market has continued to move sharply higher the sentiment has clearly shifted. The CNN Fear & Greed Index has moved from a reading of Extreme Fear to Neutral. Surprisingly the Bullish % according to AAII has stayed relatively flat over the past four weeks it has had readings of 28.1%, 37.5%, 34.1% and was 34.8% last week.
The comments from the ECB last Thursday and the surprise cut in rates by the Peoples Bank of China let a fuse under a already hot market. As I discuss in the market wrap section, many of the market averages are now in high risk buy areas which does not favor chasing the market at current levels.
The Economy
The data early last week on housing was a bright sport for the economy as the Housing Market Index, that reflects builder's sentiment, came in at a strong 64. The Housing Starts were also positive though permits were down. Last Thursday the Existing Home Sales also came in better than expected.
Last Thursday's Chicago Fed National Activity Index was weaker than expected as it indicated a " lower-than-average economic growth for the month". The better than expected PMI Flash Manufacturing Index at 54 on Friday was the best reading since last May. The weak data on manufacturing has had me concerned since the spring and maybe this report is an early sign of a turnaround.
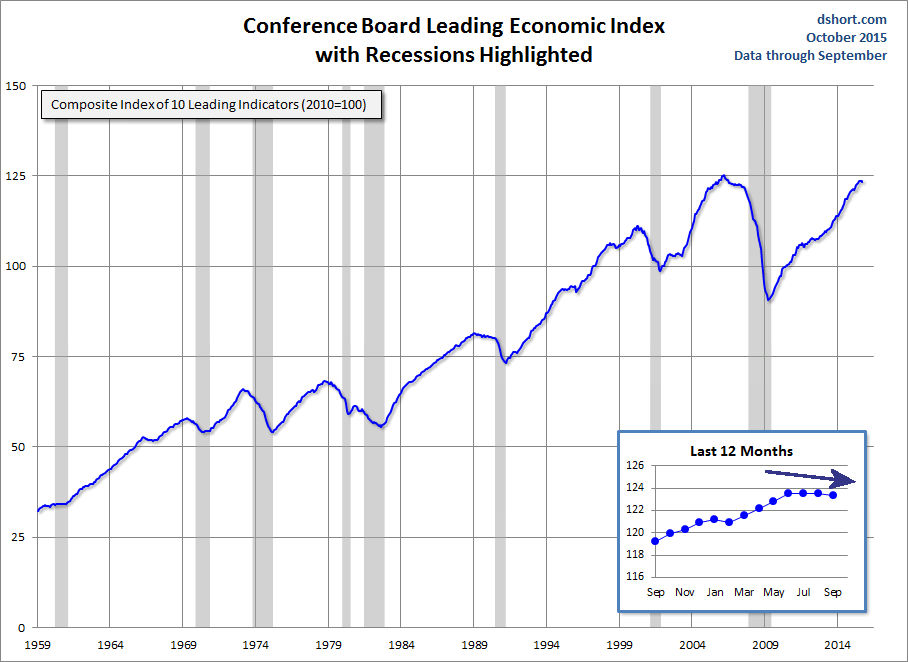
The Leading Indicators last Thursday declined 0.2% in September as for the second monthly decline in a row as lower stock prices again put pressure on the LEI. The Conference Board commented that "Despite September's decline, the U.S. LEI still suggests economic expansion will continue, although at a moderate pace," said Ataman Ozyildirim, director of business cycles and growth research at The Conference Board.
This week's data may some further insight to the economy's health with New Home Sales and the Dallas Feed Manufacturing Survey on Monday. It is followed on Tuesday by Durable Goods Orders, the S&P Case-Shiller HPI, PMI Services Flash and Consumer Confidence.
Of course the FOMC meeting starts on Tuesday and there will be an FOMC announcement on Wednesday afternoon. Next to the FOMC the market will likely be focused on the 3rd quarter advance reading on GDP which is out on Thursday along with the Pending Home Sales Index.
The Personal Income and Outlays is out on Friday, as well as the Employment Cost Index, Chicago PMI and the month ending Consumer Sentiment from the University of Michigan.
Interest Rates & Commodities
Yields closed up slightly for the week as the ranges were light despite the global action. The weekly studies are still negative but the daily studies are now trying to bottom.
Gold was lower last week as it has corrected from the mid-month highs. The SPDR Gold Trust (GLD) is now back to support so a rebound is likely in the next week or so. The volume on the rally in both the gold futures and GLD has been weak suggesting that the next rally should be an opportunity to sell gold.
Crude oil closed down over $3 per barrel last week reversing the positives from three weeks ago. In order to complete a longer term bottom formation crude needs a sharply higher close on strong volume in the next week or so.
Market Wrap
Even though the Dow Industrials closed the week up over 430 points the 2.5% gain was a bit less that the Dow Transports 2.69% gain. The Nasdaq Composite did even better as it was up 2.97% but the small caps continue to lag with just a minor 0.32% gain in the Russell 2000. Once again the market internals were positive again this week and better than the previous week.
The strong earnings form tech giants Amazon (AMZN) , Microsoft (MSFT and Alphabet (GOOGL) pushed the technology sector to a 4.4% weekly gain. The industrials continue to act well as they were up 3.3% followed by a 2.3% gain in the financials. The oil & gas stocks remained under pressure as they were down 1.3% and the health care sector was down 0.83% as the plunge in biotech stock Valeant Pharmaceuticals (VRX) has investors avoiding the whole sector.
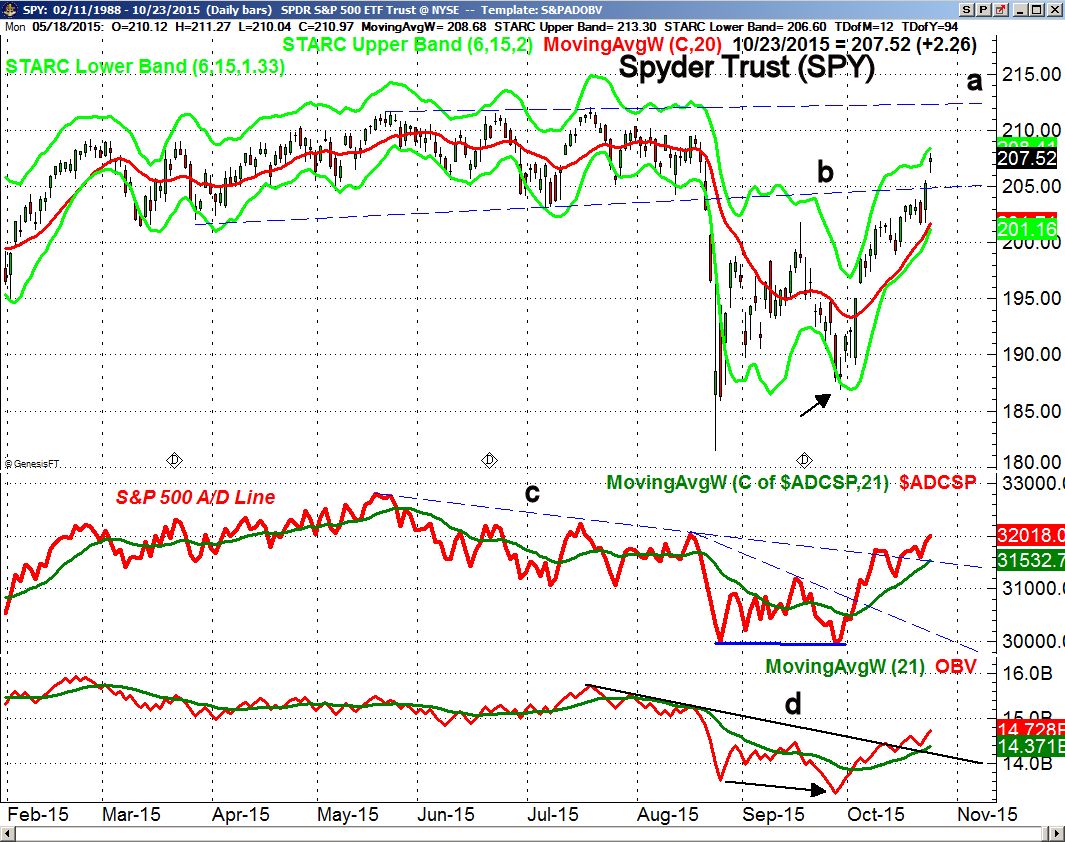
The Spyder Trust (SPY) gapped higher Friday to close just below the daily starc+ band at $208.41. The resistance at line b, was decisively overcome with next major resistance, line a, in the $212-$213 area. The weekly starc+ band is at $214.08 while the November projected pivot resistance stands at $220.32.
Since June (Three Reasons To Stay Patient) I had been warning about the negative divergence in the A/D lines including the S&P 500 A/D line. My focus had been on the downtrend, line c, which was finally overcome on October 9th. This completed the bottom formation and the breakout level was tested last week.
The OBV has broken its downtrend, line d, but is still lagging the price action. The weekly OBV (not shown) has made a new high and is acting stronger than prices. There is initial support now in the $204.50-$206 area with the rising 20 day EMA at $201.71.
The PowerShares QQQ Trust (QQQ) was up 2.8% on Friday as it opened above the daily starc+ band. It is not far below the all time high at $114.11. The weekly starc+ band is at $117.71 while the projected monthly resistance for November is at $121.59.
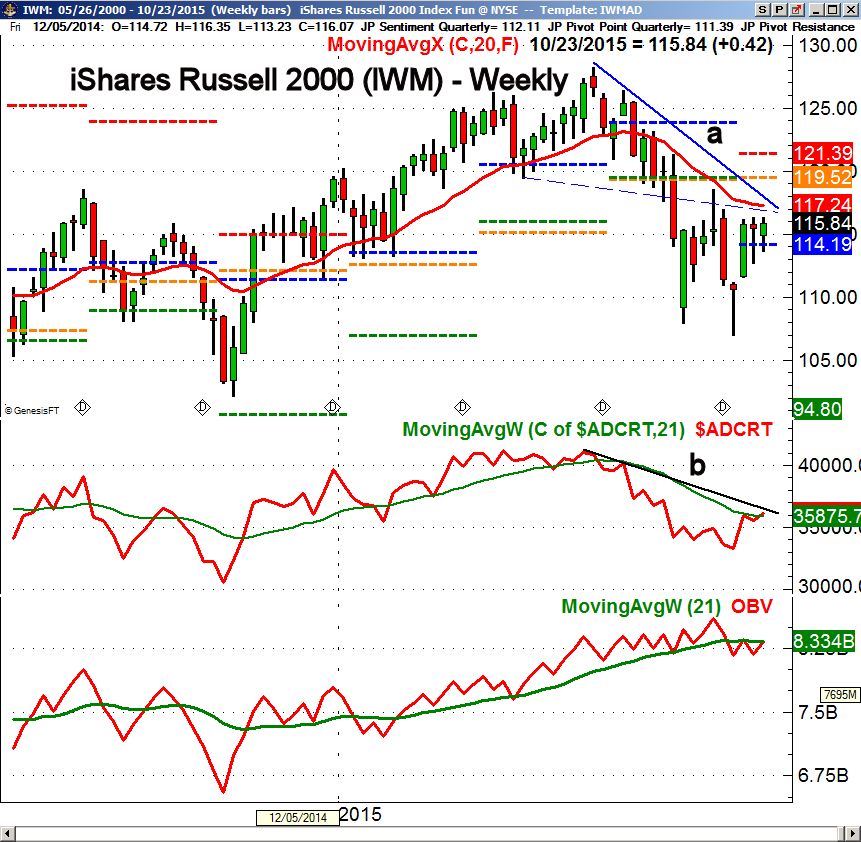
The iShares Russell 2000 (IWM) continues to lag the S&P 500 as it is up 2.44% in the past month compared to 7.18% gain in the SPY. The weekly chart shows that IWM is still below the declining 20 week EMA and the downtrend, line a, in the $117.20-$117.80 area. The quarterly pivot resistance is at $121.39.
The weekly Russell 2000 A/D line is slightly above its WMA but still below the downtrend, line b. The weekly OBV is holding up better than prices and is now close to moving back above its WMA. The daily studies are positive but are still below their key resistance levels.
What to do?
As I commented in the October 10th column " The improvement in the daily and weekly technical outlook suggests that the stock market has likely resumed its intermediate term uptrend. I will be looking for a short term pullback in the next week to buy some of the ETFs that are outperforming the S&P 500. As we enter earnings season, these ETFs allow better protection against an earnings shock in any individual stock.
The following two days of very strong market internals (Should You Be Buying The Dip?) provided additional bullish evidence and reinforced the case for buying the dip. That day the SPY closed lower at $199.24 but subsequently accelerated to the upside and is now over 4% higher.
Want specific ETF recommendations?
If you are interested in my specific trading and investing advice for the most liquid ETFs I would invite you to subscribe to the premium Viper ETF report.
In addition to specific weekly recommendations subscribers also receive exclusive trading lessons that can help you become your own investing and trading expert.
Comments
comments