Stocks, bonds, crude oil, and gold received plenty of market attention last week, but most of my focus was on the stock market. I was looking for signs from the Invesco QQQ Trust (QQQ) and specifically its advance/decline data that the stock market’s correction was over.
The QQQ strong close on July 31st was supported by the weekly close in the NDX 100 A/D line above its 21-week EMA. This was a sign that the correction in the stock market, especially the tech sector, could be over.
I suggested watching the NDX 100 A/D numbers early last week, and on Tuesday over 60% of QQQ stocks advanced, and the numbers were positive on 3 of 5 days.
The QQQ was up 5% last week and the weekly starc+ band is now at $769.07 with the yearly R2 at $783.47. The daily bear flag targets are in the $828.82 area. A weekly close under the 20-week EMA at $686 would be a sign of weakness.
The SPDR S&P 500 (SPY) gained 3.6% last week as it traded above the daily stac+ band at $777.97 on Wednesday and Thursday. This was a sign that SPY was in a high -risk buy area, which favored a pause or a setback. There is weekly pivot support at $766.30 then $755.76 with the 20-day EMA at $751.07.

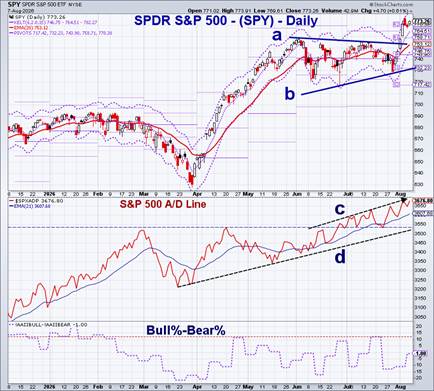
The S&P 500 A/D line broke above resistance in June and has been leading prices since then, line c. It made another new high last week with support at line d. The August R2 resistance at $770.30 has already been exceeded with the weekly starc+ band at $790.23.
From the AAII survey last week, the bull% rose to 37% from 31% while the bear% fell to 38%. The bull%-bear% rose to -1%, so there are still more bears than bulls. Both NYSE A/D lines made new highs in July, confirming higher prices.
I hope many of you are familiar with intermarket analysis and the work by my late friend John Murphy. It focuses on the fact that “all major financial markets are correlated to one degree or another. Here is a link to a 2014 presentation by John to a technical analysis group in London.
Some traders don’t realize that the technical studies must confirm the current intermarket view. For example, in 1980 the top in gold correlated with a bottom in the US dollar as it moved sharply higher through 1985.
Since then, traders who bought gold based on a view of a weaker dollar have often been on the wrong side. This is also the case with seasonal analysis, as I advise that you should trade the seasonal trends only when the technical studies agree.

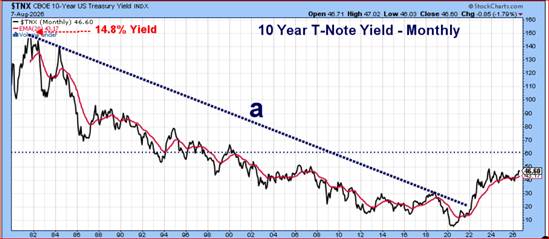
Analyzing the bond market and the direction of interest has been an integral part of my market analysis since the early 1980s. In 1981, the yield on the 10-year T-Note peaked at around 14.8% and dropped below 0.5% in 2020. The break of the long-term downtrend, line a, does look significant for the markets in the years ahead.
As is often the case, the financial markets are currently fixated on whether the Fed will raise rates at the next meeting. This chart and the major breakout in the yield of the 30-year T-Bond above 5% do make a rate hike very likely in the coming months. So what does this mean for the markets?
Higher yields are likely to be positive for the dollar, which has been declining since the middle of June when the Invesco DB Dollar Bullish Fund (UUP) peaked at $28.60. The monthly DTS turned positive in July but the weekly DTS turned negative this week.

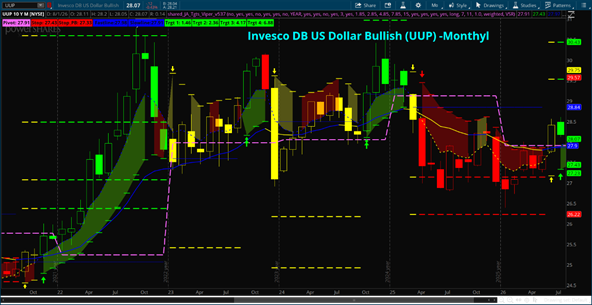
Last week UUP was down 0.35% but is well above the yearly pivot at $27.31, which should not be broken on a weekly closing basis.
In terms of stocks, higher yields and a stronger dollar are likely to benefit value stocks. Those higher yields may stall the rally in the small cap and growth ETFs so I would start watching them more closely.
Over the past three months, the SPDR Dow Jones Industrial Average ETF (DIA) has led the SPY and QQQ as it is up 9% versus a 6% gain in SPY and 4% in QQQ. The iShares Russell 1000 Value (IWD) was the top performer during the period, up 11.4%.
Both the SPDR Gold Shares (GLD) and the VanEck Gold Miners (GDX) generated positive WKS_DTS last week. For GLD, the 50% retracement resistance is at $437, but it closed 5% above its 20-day EMA at $378,89,
GDX is even more extended as it closed the week at $89,98 which is 14.9% above its 20-day EMA at $78.27. Both are above their daily starc+ bands, which does favor a pause or a pullback over the near term. Crude oil, which often trades opposite to the dollar, like the precious metals, was lower last week and needs to get back above $92.
Comments
comments