Friday’s selling ended a rough month and week for the stock market. For the month, the tech-heavy QQQ was down 6.7%, but XLK and XLC declined even more. In contrast, the Spyder Trust (SPY) was only down 0.9% for the month. The October close was just above last month’s doji low of $749.60, so no monthly doji sell signals was generated.
The punishing declines in many of the largest tech stocks increased the bear market and AI bubble fears. For those with concentrated tech portfolios, a 38% drop in Intel (INTC) is not easy to handle. The weekly RS and OBV have been negative for INTC since early in the month.
The divergence between SPY and the QQQ has become more pronounced. Last week, less than 10% of the SPY stocks were lower, while over 30% of the QQQ stocks have declined on average over the past three weeks. Both the weekly and monthly S&P 500 A/D lines are rising and above their WMAs.
The Nasdaq 100 A/D lines are also diverging and are positive despite the sharp price decline. The chart (next page) reveals two consecutive weekly closes below the 20-week EMA. The 200-day SMA is at $678, with the weekly starc- band at $676. The weekly starc- bands were exceeded in April 2025 and tested in April 2026 (see Yahoo chart ), which corresponded with important correction lows. Long-term readers may recall the panic declines in 2016, 2018, and in the fall of 2022, just to mention a few, where similar selling created good buying opportunities.

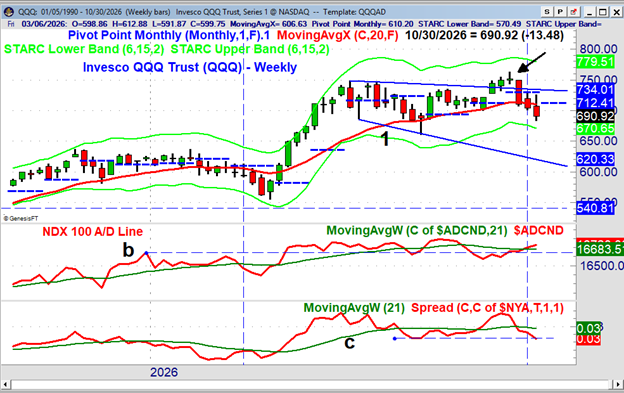
The recent rally failure in the IWF-IWD helps to explain the sharp decline in the growth stocks. There are no signs that the overall market is bottoming, though an oversold bounce is expected. I will be watching the market more closely for signs of a bottom as the monthly pivot levels are regained. I hope to have more on the sector outlook this Sunday afternoon on the Viper Report.com.
In answer to the central questions, I do not see evidence that this is the start of a new bear market. Also the drop in the AI stocks in my experience, looks more like a panic correction than a change in the major trend.
Any Sector sweet spots? In light of last week's carnage in the markets and slight improvement in my back, I decided to do a deeper dive into my sector analysis. Using stock charts and performance tables can sometimes give me a different perspective and while this table points out the disparities that were discussed in the weekly brief the three month, one month and yearly performance demonstrates the importance of the holding time. Of course, I also look at the relationship of these sector ETFs to their quarterly pivots as well as starc-bands, which can identify oversold extremes.
Many of the recent winners like XLP, XLV, and XLB still have positive 3 Mth and YTD performance. Those who just got in XLK are likely not happy, but the YTD of +25.1% cannot be ignored. As we start a new month, one should also pay attention to the October closing price in relation to not only the Q-Piv but also the new monthly pivots, as they can be quite helpful in establishing new positions if the other technical factors are in agreement.

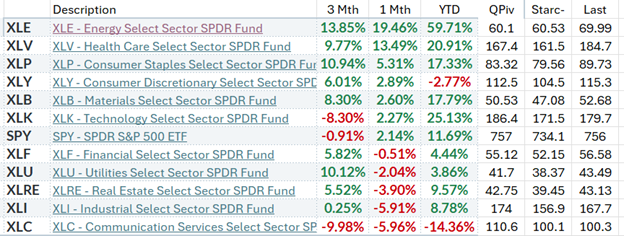
Many of you have likely already realized that when a market closes the week above its starc+ band, it's generally not a good time to buy. Conversely, a close below the weekly starc- band, like we observed last week in XLC, can help you avoid selling in a panic. The weekly close at or below the weekly starc- band doesn't guarantee it won't still go lower over the near term, but it does indicate it is likely to be higher in the next few weeks.
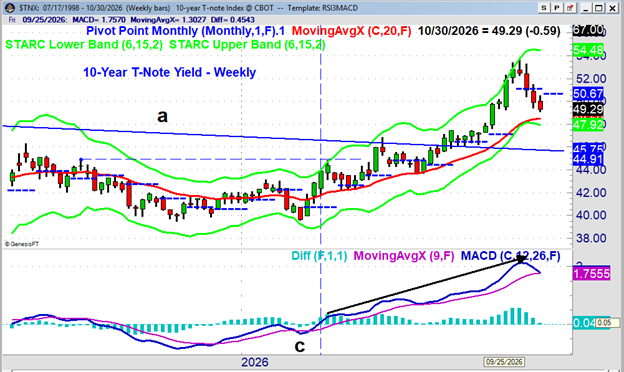
The starc band analysis has been very helpful in my analysis of interest rates as six weeks ago the yield on the 10-year T-Note moved above its weekly starc+ band as the yield reached a high of 5.346% before it turned lower. The yield closed last week at 4.929% with the 20-day EMA at 4.850%. The weekly MACDs and MACD-His are now close to turning negative. But my analysis indicates that the decline in the 10-year note yield is close to being over. A weekly close back above the November pivot at 5.067% will indicate yields are now moving higher.


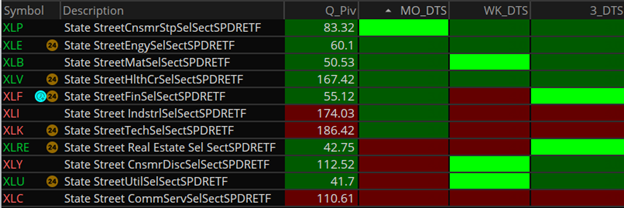
This week's DTS readings have a new positive MO_DTS for XLP, while the monthly readings are still negative on XLRE, XLY, XLU, and XLC. Mixed readings for the WKS_DTS but the new + signals favor XLB, over XLY and XLU that still have negative MO_DTS.
Two other ETFs I am watching are the U.S. Home Construction (ITB) and the iShares U.S. Aerospace & Defense (ITA). The WKS_DTS and 3_DTS are now positive for ITB, as the WKS just flipped this week. The MO_DTS is negative for ITB, as are the MO, WKS, and 3_DTS for ITA.

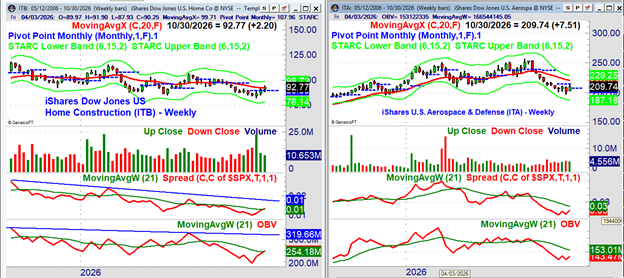
For ITB, the weekly RS and OBV closed the week above their WMAs, which is a positive sign. If the downtrends in the RS and OBV are overcome, it will suggest a major low is in place.
The weekly RS and OBV analysis is still negative for ITA, while the daily studies are close to turning positive, even though ITA did close below the new pivot at $214.52.
Comments
comments